Next Page Previous Page Home Tools & Aids Search Handbook
8. Assessing Product Reliability
8.1. Introduction
8.1.6. What are the basic lifetime distribution models used for non-repairable populations?

8.1.6.5.

Gamma

Formulas for the gamma model Formulas and Plots

There are two ways of writing (parameterizing) the gamma distribution that are common in the literature. In addition, different authors use different symbols for the shape and scale parameters. Below we show three ways of writing the gamma, with aalphabeta, the "shape" parameter, and b =1/beta, the scale parameter. The first choice of parameters (a,b) will be the most convenient for later applications of the gamma. EXCEL uses(alpha,beta) while Dataplot uses(gamma,beta)
PDF: f(t,a,b) = (b**a/GAMMA(a))*t**(a-1)*EXP(-b*t)    or     f(t,alpha,beta) = (1/(beta**alpha*GAMMA(alpha)))*t**(alpha-1)*EXP(-t/beta)    or     f(t,gamma,beta) = (1/(beta**gamma*GAMMA(gamma)))*t**(gamma-1)*EXP(-t/beta)CDF: F(t) = INTEGRAL[0 to t]f(t)dtRELIABILITY: R(t) = 1 - F(t)FAILURE RATE: h(t) = f(t)/R(t)MEAN: a/b  or alpha*beta   or gamma*betaVARIANCE: a/b**2  or alpha*beta**2  or gamma*beta**2

The exponential is a special case of the gamma Note: When a = 1, the gamma reduces to an exponential distribution with blambda

Another well-known statistical distribution, the Chi-Square, is also a special case of the gamma. A Chi-Square distribution with n degrees of freedom is the same as a gamma with a = n/2 and b = .5 (orbeta = 2). 

The following plots give examples of gamma PDF, CDF and failure rate shapes.

Shapes for Gamma data Plot of gamma PDF's with different shape parameters
Gamma CDF shapes Plot of gamma CDF's with different shape parameters
Gamma failure rate shapes Plot of gamma failure rates with different shape parameters
The gamma is used in "Standby" system models and also for Bayesian reliability analysis Uses of the Gamma Distribution Model
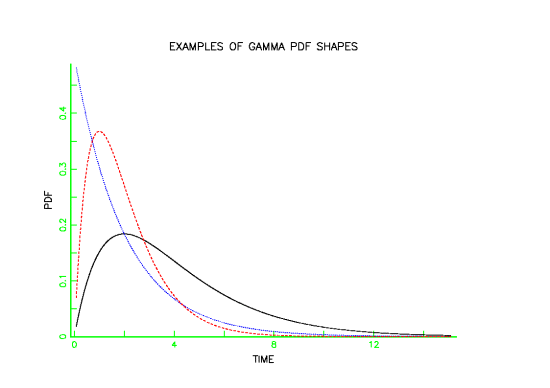
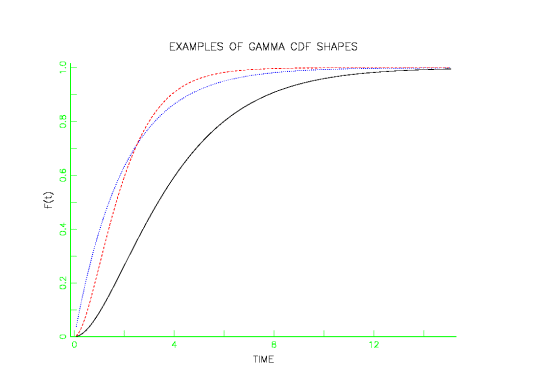
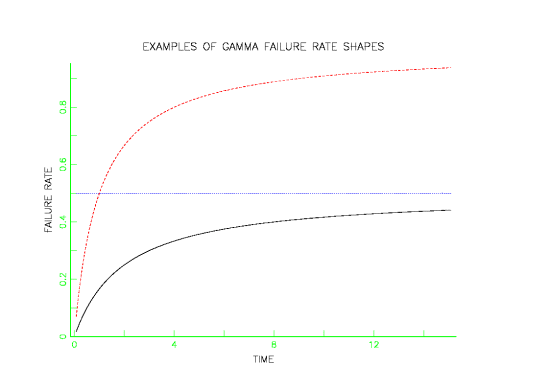
  1. The gamma is a flexible life distribution model that may offer a good fit to some sets of failure data. It is not, however, widely used as a life distribution model for common failure mechanisms.
  2. The gamma does arise naturally as the time-to-first fail distribution for a system with standby exponentially distributed backups. If there are n-1 standby backup units and the system and all backups have exponential lifetimes with parameter lambda, then the total lifetime has a gamma distribution with a = n and b =lambda. Note: when a is a positive integer, the gamma is sometimes called an Erlang distribution. The Erlang distribution is used frequently in queuing theory applications. 
  3. A common use of the gamma model occurs in Bayesian reliability applications. When a system follows an HPP (exponential) model with a constant repair rate lambda, and it is desired to make use of prior information about possible values of lambda, a gamma Bayesian prior forlambda is a convenient and popular choice. 
Dataplot and EXCEL gamma functions Dataplot and EXCEL Functions for the Gamma

To calculate the PDF, CDF, Reliability and failure rate at time t for a gamma with parameters a and b = 1/beta, use the following Dataplot statements: 

LET PDF = GAMPDF(t,a,0,b)
LET CDF = GAMCDF(t,a,0,b)
LET REL = 1-CDF
LET FR = PDF/REL
Using an example solved in the section on standby models, if a = 2,  b = 1/30 and t = 24 months, the statements are:
 
LET PDF = GAMPDF(24, 2, 0, 30) response is .01198
LET CDF = GAMCDF(24, 2, 0, 30) response is .1912
LET REL = 1-CDF response is .8088
LET FR=PDF/REL response is .0148

To generate random gamma data we first have to set the "a" parameter (called "gamma" by Dataplot). The following commands generate 100 gamma data points chosen randomly from a gamma distribution with parameters a and b

LET GAMMA = a
LET DATA = GAMMA RANDOM NUMBERS FOR I = 1 1 100
LET DATA = (1/b)*DATA
For the above example this becomes
LET GAMMA = 2
LET DATA = GAMMA RANDOM NUMBERS FOR I = 1 1 100
LET DATA = 30*DATA
Continuing this example, we can now do a gamma probability plot of the 100 points in DATA. The commands are 
LET GAMMA = 2
X1LABEL EXPECTED (NORMALIZED) VALUES
Y1LABEL TIME
GAMMA PROBABILITY PLOT DATA
The resulting plot is shown below. 

Gamma probability plot of 100 random gamma numbers

Note that the value of gamma can be estimated using a PPCC plot.

EXCEL also has built-in functions to evaluate the gamma pdf and cdf. The syntax is: 

=GAMMADIST(t,a,1/b,FALSE) for the PDF
=GAMMADIST(t,a,1/b,TRUE) for the CDF
Home Tools & Aids Search Handbook Previous Page Next Page