
1.3. EDA Techniques
1.3.3. Graphical Techniques: Alphabetic
1.3.3.14. Histogram
1.3.3.14.8. |
Histogram Interpretation: Symmetric with Outlier |
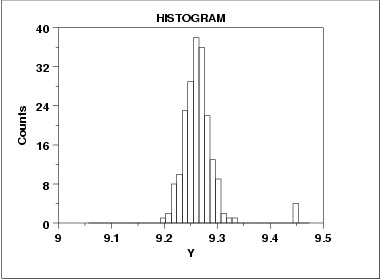
A symmetric distribution is one in which the 2 "halves" of the histogram appear as mirror-images of one another. The above example is symmetric with the exception of outlying data near Y = 4.5.
An outlier is a data point that comes from a distribution different (in location, scale, or distributional form) from the bulk of the data. In the real world, outliers have a range of causes, from as simple as
- operator blunders
- equipment failures
- day-to-day effects
- batch-to-batch differences
- anomalous input conditions
- warm-up effects
- A change in settings of factors that (knowingly or
unknowingly) affect the response.
- Nature is trying to tell us something.
The classic case of automatic outlier rejection becoming automatic information rejection was the South Pole ozone depletion problem. Ozone depletion over the South Pole would have been detected years earlier except for the fact that the satellite data recording the low ozone readings had outlier-rejection code that automatically screened out the "outliers" (that is, the low ozone readings) before the analysis was conducted. Such inadvertent (and incorrect) purging went on for years. It was not until ground-based South Pole readings started detecting low ozone readings that someone decided to double-check as to why the satellite had not picked up this fact--it had, but it had gotten thrown out!
The best attitude is that outliers are our "friends", outliers are trying to tell us something, and we should not stop until we are comfortable in the explanation for each outlier.
- Graphically check for outliers (in the commonly encountered
normal case) by generating a
box plot.
In general, box plots are a much better graphical tool for
detecting outliers than are histograms.
- Quantitatively check for outliers (in the commonly encountered normal case) by carrying out Grubbs test which indicates how many sample standard deviations away from the sample mean are the data in question. Large values indicate outliers.
