
1.4. EDA Case Studies
1.4.2. Case Studies
1.4.2.10. Ceramic Strength
1.4.2.10.3. |
Analysis of the Batch Effect |
We will investigate the batch factor first.
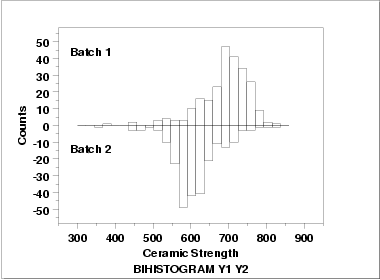
This bihistogram shows the following.
- There does appear to be a batch effect.
- The batch 1 responses are centered at 700 while the
batch 2 responses are centered at 625. That is, the
batch effect is approximately 75 units.
- The variability is comparable for the 2 batches.
- Batch 1 has some skewness in the lower tail. Batch 2 has
some skewness in the center of the distribution, but not
as much in the tails compared to batch 1.
- Both batches have a few low-lying points.
Although we could stop with the bihistogram, we will show a few other commonly used two-sample graphical techniques for comparison.
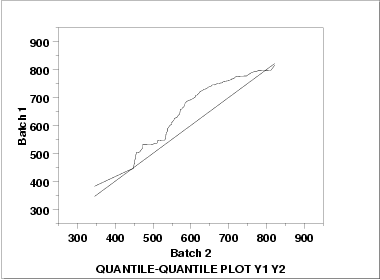
This q-q plot shows the following.
- Except for a few points in the right tail, the batch 1 values
have higher quantiles than the batch 2 values. This implies
that batch 1 has a greater location value than batch 2.
- The q-q plot is not linear. This implies that the difference between the batches is not explained simply by a shift in location. That is, the variation and/or skewness varies as well. From the bihistogram, it appears that the skewness in batch 2 is the most likely explanation for the non-linearity in the q-q plot.
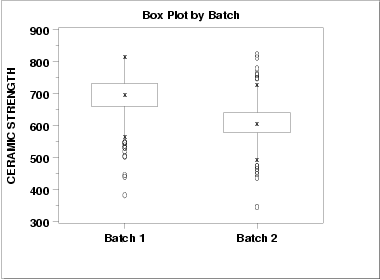
This box plot shows the following.
- The median for batch 1 is approximately 700 while the median
for batch 2 is approximately 600.
- The spread is reasonably similar for both batches, maybe
slightly larger for batch 1.
- Both batches have a number of outliers on the low side. Batch 2 also has a few outliers on the high side. Box plots are a particularly effective method for identifying the presence of outliers.
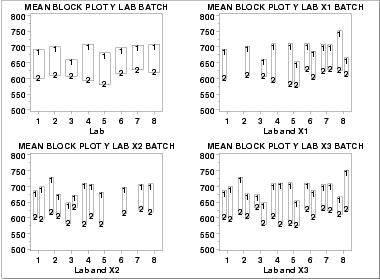
These block plots show the following.
- The mean for batch 1 is greater than the mean for batch 2 in all of the cases above. This is strong evidence that the batch effect is real and consistent across labs and primary factors.
Batch 1:
    NUMBER OF OBSERVATIONS =  240
    MEAN                   =  688.9987
    STANDARD DEVIATION     =   65.5491
    VARIANCE               = 4296.6845

Batch 2:
    NUMBER OF OBSERVATIONS =  240
    MEAN                   =  611.1559
    STANDARD DEVIATION     =   61.8543
    VARIANCE               = 3825.9544
H0:  σ12 = σ22
Ha:  σ12 ≠ σ22

Test statistic:  F = 1.123
Numerator degrees of freedom:  ν1 = 239
Denominator degrees of freedom:  ν2 = 239
Significance level:  α = 0.05
Critical values:  F1-α/2,ν1,ν2 = 0.845
                  Fα/2,ν1,ν2 = 1.289
Critical region:  Reject H0 if F < 0.845 or F > 1.289
H0:  μ1 = μ2
Ha:  μ1 ≠ μ2

Test statistic:  T = 13.3806
Pooled standard deviation:  sp = 63.7285
Degrees of freedom:  ν = 478
Significance level:  α = 0.05
Critical value:  t1-α/2,ν = 1.965
Critical region: Reject H0 if |T| > 1.965
The t-test indicates that the mean for batch 1 is larger than the mean for batch 2 at the 5 % significance level.
- There is in fact a significant batch effect. This batch
effect is consistent across labs and primary factors.
- The magnitude of the difference is on the order of 75 to 100
(with batch 2 being smaller than batch 1). The standard
deviations do not appear to be significantly different.
- There is some skewness in the batches.
This batch effect was completely unexpected by the scientific investigators in this study.
Note that although the quantitative techniques support the conclusions of unequal means and equal standard deviations, they do not show the more subtle features of the data such as the presence of outliers and the skewness of the batch 2 data.
