
|
2. Measurement Process Characterization 2.5. Uncertainty analysis 2.5.3. Type A evaluations 2.5.3.3. Type A evaluations of bias 2.5.3.3.3. Bias with sparse data |
|
| Strategy for dealing with limited data | The purpose of this discussion is to outline methods for dealing with biases that may be real but which cannot be estimated reliably because of the sparsity of the data. For example, a test between two, of many possible, configurations of the measurement process cannot produce a reliable enough estimate of bias to permit a correction, but it can reveal problems with the measurement process. The strategy for a significant bias is to apply a 'zero' correction. The type A uncertainty component is the standard deviation of the correction, and the calculation depends on whether the bias is |
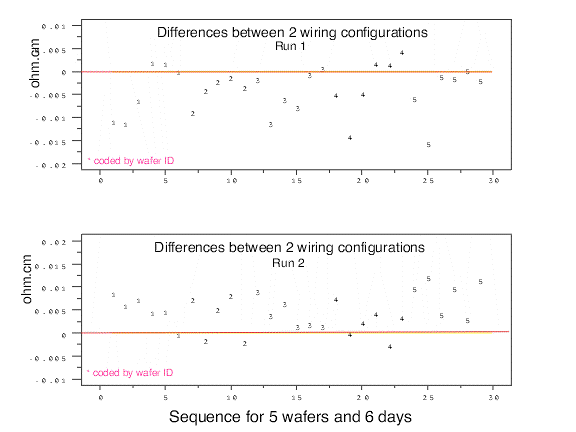
| Example of differences among wiring settings | An example is given of a study of wiring settings for a single gauge. The gauge, a 4-point probe for measuring resistivity of silicon wafers, can be wired in several ways. Because it was not possible to test all wiring configurations during the gauge study, measurements were made in only two configurations as a way of identifying possible problems. |
| Data on wiring configurations | Measurements were made on six wafers over six days (except for 5 measurements on wafer 39) with probe #2062 wired in two configurations. This sequence of measurements was repeated after about a month resulting in two runs. A database of differences between measurements in the two configurations on the same day are analyzed for significance. |
| Run software macro for making plotting differences between the 2 wiring configurations |
A plot of the differences between the 2 configurations
shows that the differences for run 1 are, for the most part, < zero, and
the differences for run 2 are > zero. The following
Dataplot commands produce the plot:
dimension 30 columns skip 25 read mpc536.dat wafer day probe d1 d2 let n = count probe let t = sequence 1 1 n let zero = 0 for i = 1 1 n lines dotted blank blank characters blank 1 2 x1label = DIFFERENCES BETWEEN 2 WIRING CONFIGURATIONS x2label SEQUENCE BY WAFER AND DAY plot zero d1 d2 vs t |
| Statistical test for difference between 2 configurations |
A t-statistic is used as an approximate test where we are assuming the
differences are approximately normal. The average difference and
standard deviation of the difference are required for this test. If
the difference between the two configurations is statistically significant. The average and standard deviation computed from the N = 29 differences in each run from the table above are shown along with corresponding t-values which confirm that the differences are significant, but in opposite directions, for both runs. Average differences between wiring configurations Run Probe Average Std dev N t 1 2062 - 0.00383 0.00514 29 - 4.0 2 2062 + 0.00489 0.00400 29 + 6.6 |
| Run software macro for making t-test |
The following Dataplot commands
let dff = n-1
let avgrun1 = average d1
let avgrun2 = average d2
let sdrun1 = standard deviation d1
let sdrun2 = standard deviation d2
let t1 = ((n-1)**.5)*avgrun1/sdrun1
let t2 = ((n-1)**.5)*avgrun2/sdrun2
print avgrun1 sdrun1 t1
print avgrun2 sdrun2 t2
let tcrit=tppf(.975,dff)
reproduce the statistical tests in the table.
 PARAMETERS AND CONSTANTS--

     AVGRUN1 -- -0.3834483E-02
     SDRUN1  --  0.5145197E-02
     T1      -- -0.4013319E+01

 PARAMETERS AND CONSTANTS--

     AVGRUN2 --  0.4886207E-02
     SDRUN2  --  0.4004259E-02
     T2      --  0.6571260E+01
|
| Case of inconsistent bias |
The data reveal a significant wiring bias
for both runs that changes direction between runs. Because of this
inconsistency, a 'zero' correction is applied to the results, and the
type A uncertainty is taken to be
For this study, the type A uncertainty for wiring bias is
|
| Case of consistent bias |
Even if the bias is consistent over time, a 'zero'
correction is applied to the results, and for a single run, the
estimated standard deviation of the correction is
For two runs (1 and 2), the estimated standard deviation of the correction is
|
