|
- Question:
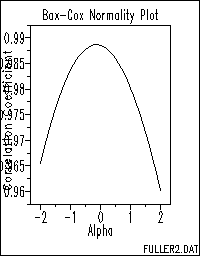
- What is best transformation to normality?
- Definition:
- Vertical Axis : Normal probability plot correlation
coefficient
- Horizontal Axis: Box-Cox power transformation parameter
(lambda)
- Interpretation/Conclusion:
- Best transformation is lambda = 0 (i.e., logarithmic)
- NIST/SEMATECH Handbook Chapter:
- 1.
Exploratory Data Analysis
- References:
- NIST/SEMATECH e-Handbook of Statistical Methods,
Box-Cox Linearity Plot, 6/2003.
- Box and Cox (1964), "An Analysis of of transformations,"
Journal of the Royal Statistical Society,
Series B 26 (2): 211–252.
|
