6 PLOT
Name:
Type:
Purpose:
Generate 6 plots on the same page that are useful after a fit.
Description:
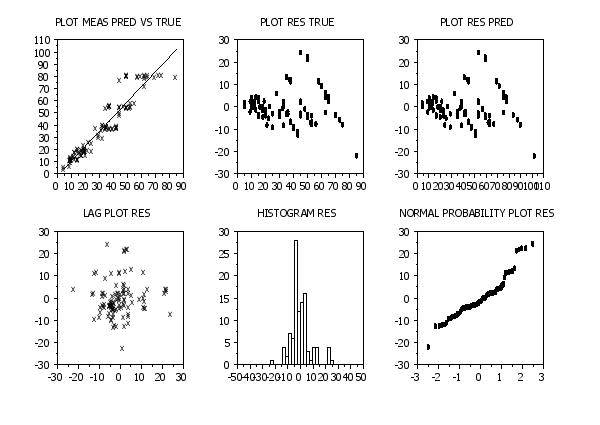
This plot is used after some type of fit to generate some of the
most common diagnostic plots in a convenient way. The plots are:
- observed and fitted dependent values against the independent
variable (the observed values are automatically drawn using
the plot symbol X while the predicted values are drawn as a
solid line);
- the residuals versus the independent variable (uses whatever
the current settings are for the LINE and CHARACTERS
commands);
- the residuals versus the predicted values (uses whatever the
current settings are for the LINE and CHARACTERS commands);
- a lag plot of the residuals (uses an X as the plot symbol);
- a histogram of the residuals;
- and a normal probability plot of the residuals.
The 6-PLOT command does not perform a fit. It assumes that this has
been done in a prior command and that the PRED and RES variables
are the results from that fit. The dependent variable and the
independent variable used in the fit are given as the 2 arguments to
the 6-PLOT command. If a multi-variable fit was performed, specify
the independent variable you want to use on the horizontal axis for
the first 2 plots (plots against the remaining indepdendent
will have to be generated with additional PLOT commands).
Syntax:
6-PLOT <y> <x>
<SUBSET/EXCEPT/FOR qualification>
where <y> is the dependent variable that was used in the most
recent fit;
<x> is an independent variable used in the most recent
fit;
and where the <SUBSET/EXCEPT/FOR qualification> is optional.
Examples:
6-PLOT Y X
6-PLOT RUN1
6-PLOT Y1 SUBSET TAG = 1
Note:
If a fit has not yet been performed, Dataplot does not automatically
generate one (and so the PRED and RES variables still contain all
zero values).
Note:
Various commands generate updated values for RES and PRED.
Specifically, LOWESS, SMOOTH, SPLINE FIT, and several others
automatically update these variables. Be sure that the fit you want
to plot was the most recent command to update the RES and PRED
variables before entering the 6-PLOT command.
Note:
By default, the 6-PLOT command ignores the MULTIPLOT CORNER
COORDINATE settings. That is, the 6-plot will be generated
as if the following command had been entered
MULTIPLOT CORNER COORDINATES 15 20 85 90
If you want the 6-PLOT command to utilize the settings from
the MULTIPLOT CORNER COORDINATE command, enter
To restore the default of ignoring the MULTIPLOT CORNER
COORDINATE settings, enter
Default:
Synonyms:
Related Commands:
Applications:
Exploratory Data Analysis
Implementation Date:
1993/12
2002/03: Added SET 6PLOT MULTIPLOT command
Program:
. ALASKA PIPELINE RADIOGRAPHIC DEFECT BIAS CURVE
. PERFORM A LINEAR REGRESSION
SKIP 25
READ BERGER1.DAT TRUE MEAS
FIT MEAS TRUE
TITLE AUTOMATIC
TITLE SIZE 4
CHARACTER CIRCLE
CHARACTER SIZE 2.5
TIC MARK LABEL SIZE 4
CHARACTER FILL ON
LINE BLANK SOLID
SET 6PLOT MULTIPLOT ON
MULTIPLOT CORNER COORDINATES 5 5 95 95
6-PLOT MEAS TRUE
Date created: 06/09/2016
Last updated: 12/04/2023
Please email comments on this WWW page to
alan.heckert@nist.gov.
|
|
