
|
|
ISO 13528 ZSCORE PLOTName:
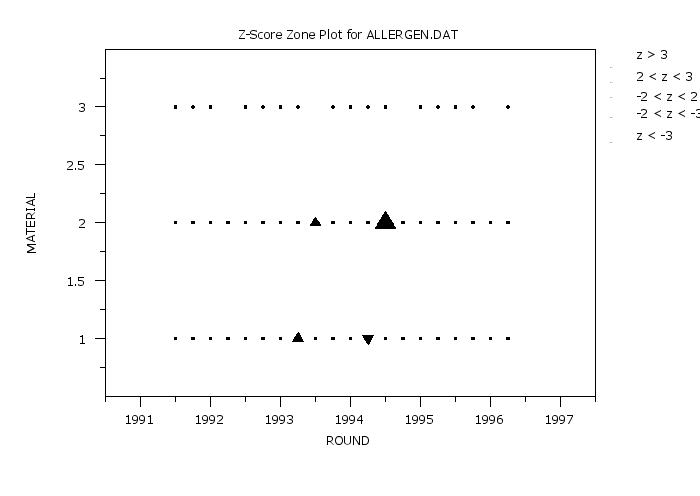
For a given laboratory, define a grid using the MATID variable for the vertical axis and the ROUNDID variable for the horizontal axis. Then for each material/round cell compute the z-score for the given laboratory. If the laboratory has replicated values, compute the average z-score for the cell. Based on the z-score, define the plot symbol for the cell based on
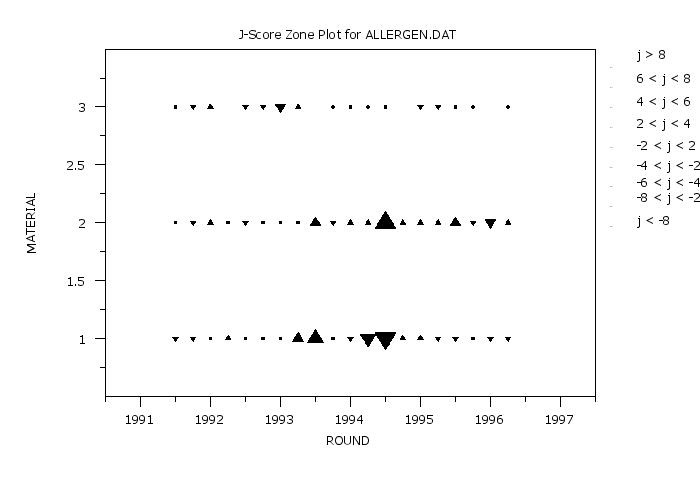
The +/-2 limits typically define a "warning" signal while the +/-3 limits typically define an "action" signal. Alternatively, j-scores can be used. The j-score is computed as follows:
Although the j-score is not part of the 13528 standard, it has been recommended in analyzing 13528-based proficiency studies (see the Thompson and Jaehn references below). The j-score combines properties of both the mean control chart and the cusum control charts. Specifically, it can detect both abrupt changes (i.e., j-scores for a given round > 8 or < -8) and drift in the result (i.e., several successive positive j-scores or several successive negative j-scores). Based on the final j-score, define the plot symbol for the cell based on
The Program example below demonstrates how to set the plot symbols. The plots described here are not part of the ISO 13528 standard. However, they are described in Thompson, Ellison, and Wood (2006) and in Jaehn (1991) (see References below) and are used in the context of ISO 13528 multi-round proficiency studies. These plots are alternatives to the control charts given in the ISO 13528 standard. Thompson, Ellison, and Wood refer to the z-score and j-score plots described here as zone plots.
<SUBSET/EXCEPT/FOR qualification> where <z> is a response variable containing z-scores; <matid> is a variable that specifies the material-id; <roundid> is a variable that specifies the round-id; and where the <SUBSET/EXCEPT/FOR qualification> is optional. This syntax is used to generate the z-score version of the plot. The SUBSET clause is typically used to specify a single laboratory (see the Examples below). If no laboratory is specified on the SUBSET clause, then the different laboratories are treated like replications from a single laboratory.
<SUBSET/EXCEPT/FOR qualification> where <z> is a response variable containing z-scores; <matid> is a variable that specifies the material-id; <roundid> is a variable that specifies the round-id; and where the <SUBSET/EXCEPT/FOR qualification> is optional. This syntax is used to generate the j-score version of the plot. The SUBSET clause is typically used to specify a single laboratory (see the Examples below). If no laboratory is specified on the SUBSET clause, then the different laboratories are treated like replications from a single laboratory.
ISO 13528 JSCORE PLOT Z MATID ROUNDID SUBSET LABID = 32
Jaehn (1991), "The Zone Control Chart", Quality Progress, 24, pp. 65-68. Howarth, Richard J. (2003), "The J-chart: a simple plot that combines the capabilities of Shewart and cusum charts, for use in analytical quality control," AMC Technical Brief, Royal Society of Chemistry, No. 12. ISO 13528 (2005), "Statistical Methods for use in proficiency testing by interlaboratory comparisons," First Edition, 2005-09-01.
2015/10: Correction to j-score computation
. Step 1:   Read the data
.
dimension 40 columns
skip 25
read allergen.dat z labid matid year quarter
let roundid = year + (quarter-1)/4
skip 0
.
. Step 2:   Set plot control setting
.
case asis
title case asis
title offset 2
.
line blank all
character circle tria revtri tria revtri
character hw 0.5 0.375 2.0 1.50 2.0 1.50 4 3 4 3
character fill on all
.
tic mark offset units data
tic mark offset 0.5 0.5
.
. Step 3:   Generate plot
.
y1label Material
x1label Round
title Z-Score Zone Plot for ALLERGEN.DAT
iso 13528 zscore plot z matid roundid
.
line solid all
character blank all
justification center
fill on
font simplex
hw 4 3
move 87.5 86
text tria()
hw 2 1.5
move 87.5 83
text tria()
hw 0.5 0.375
move 87.5 80
text circ()
hw 2 1.5
move 87.5 76
text revt()
hw 4 3
move 87.5 71
text revt()
justification left
fill off
font tektronix
.
hw 2 1
move 91 88
text z > 3
move 91 83.5
text 2 < z < 3
move 91 79.5
text -2 < z < 2
move 91 76
text -2 < z < -3
move 91 71.5
text z < -3
 Program 2:
. Step 1:   Read the data
.
dimension 40 columns
skip 25
read allergen.dat z labid matid year quarter
let roundid = year + (quarter-1)/4
skip 0
.
. Step 2:   Set plot control setting
.
case asis
title case asis
title offset 2
.
line blank all
character circle tria revtri tria revtri tria revtri tria revtri
character hw 0.5 0.375 1.0 0.75 1.0 0.75 2.0 1.50 2.0 1.50 ...
             3.0 2.25 3.0 2.25 4 3 4 3
character fill on all
.
tic mark offset units data
tic mark offset 0.5 0.5
.
y1label Material
x1label Round
title J-Score Zone Plot for ALLERGEN.DAT
iso 13528 jscore plot z matid roundid
.
line solid all
character blank all
justification center
fill on
font simplex
.
hw 4 3
move 87.5 86
text tria()
.
hw 3 2.25
move 87.5 82
text tria()
.
hw 2 1.5
move 87.5 78
text tria()
.
hw 1 0.75
move 87.5 74
text tria()
.
hw 0.5 0.375
move 87.5 70
text circ()
.
hw 1 0.75
move 87.5 66
text revt()
.
hw 2 1.5
move 87.5 62
text revt()
.
hw 3 2.25
move 87.5 58
text revt()
.
hw 4 3
move 87.5 54
text revt()
.
justification left
fill off
font tektronix
.
hw 2 1
move 91 88
text j > 8
move 91 83
text 6 < j < 8
move 91 78.5
text 4 < j < 6
move 91 74
text 2 < j < 4
move 91 69.5
text -2 < j < 2
move 91 65.5
text -4 < j < -2
move 91 62
text -6 < j < -4
move 91 59
text -8 < j < -2
move 91 54.5
text j < -8
Date created: 02/18/2015 |
Last updated: 12/04/2023 Please email comments on this WWW page to alan.heckert@nist.gov. | |||||||||||||||||||||||||||||||||||||||||||||||||||||||||||||||||||||||||||||||||||||||||||||||||||||||