
|
|
LET PLOTName:
In most applications, only the first few settings need to be specified, so the CHARACTER, LINE, SPIKE, BAR, and REGION (and associated attribute setting) commands are straightforward to use. However, there are occassions where we would like to be able to change the setting for a high trace number without entering the values for all the lower trace numbers. This command was added to allow you to do that.
where <command> is the desired command; <index> is a number or parameter that specifies the trace id; and <setting> specifies the value being set. The available commands are listed in a NOTE section below. The <index> value should be an integer in the range 1 to 100 (real numbers are rounded to the closest integer). The allowed value for <setting> is dependent on <command>
where <command> is the desired command; <index> is a variable containing one or more trace id's; and <setting> is a list of one or more values. This syntax allows you to set more than one value. This syntax is demonstrated in the Program 3 section below.
LET PLOT CHARACTER FILL 24 = ON
LET IINDEX = DATA 21 22 23 24
LET IINDEX = DATA 21 22 23 24
CHARACTER ANGLE CHARACTER CASE CHARACTER COLOR CHARACTER FILL CHARACTER FONT CHARACTER HW CHARACTER JUSTIFICATION CHARACTER OFFSET CHARACTER SIZE CHARACTER THICKNESS
LINE
SPIKE
BAR
REGION The Program examples below demonstrate many of these.
skip 25
read gear.dat y x
.
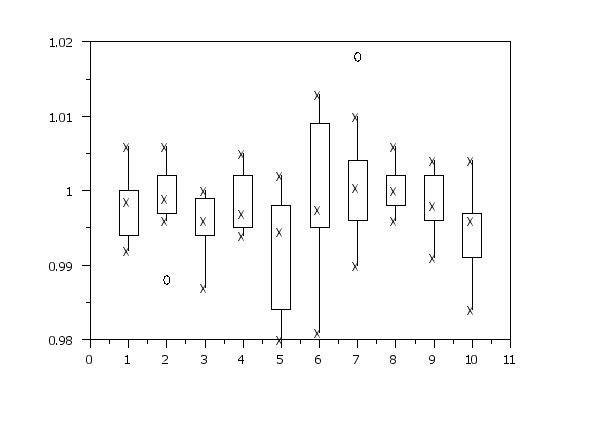
. Generate box plot standard way
.
char box plot
line box plot
fences on
box plot y x
.
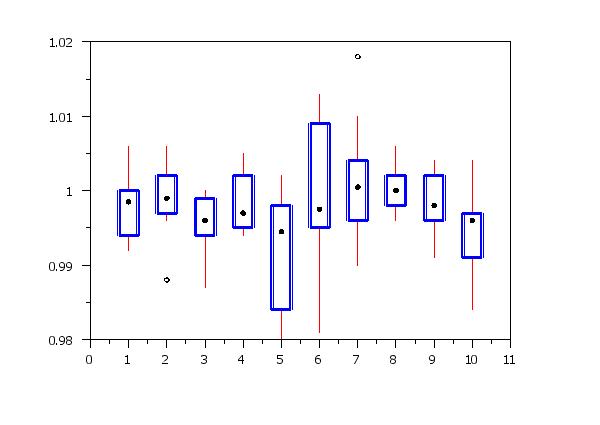
. Now use "let plot ..." to modify appearance of plot
.
let plot character 1 = blank
let plot character 4 = circle
let plot character 7 = blank
let plot character fill 4 = on
let iindex = 4
let plot character hw iindex = 1.0 0.75
let plot character hw 21 = 2.0 1.5
let plot character hw 22 = 1.0 0.75
let plot character hw 23 = 1.0 0.75
let plot character hw 24 = 2.0 1.5
let plot line color 8 = red
let plot line color 13 = red
let plot line thickness 8 = 0.25
let plot line thickness 13 = 0.25
.
let plot line thickness 14 = 0.3
let plot line thickness 15 = 0.3
let plot line thickness 16 = 0.3
let plot line thickness 20 = 0.3
let plot line color 14 = blue
let plot line color 15 = blue
let plot line color 16 = blue
let plot line color 20 = blue
.
box plot y x
 Program 2:
.  This is similar to Program 1, except use Syntax 2 for
.  some cases.
skip 25
read gear.dat y x
.
.  Now use "let plot ..." to modify appearance of plot
.
let indexv = data 1 4 7
let plot character indexv = blank circle blank
let plot character fill indexv = on
let iindex = 4
let plot character hw iindex = 1.0 0.75
let indexv = data 21 22 23 24
let plot character hw indexv = 2.0 1.5 1.0 0.75 1.0 0.75 2.0 1.5
let indexv = data 8 13
let plot line color indexv = red
let plot line thickness indexv = 0.25
.
let indexv = data 14 15 16 20
let plot line thickness indexv = 0.3
let plot line color indexv = blue
.
box plot y x
 Program 3:
. Following demonstrates the syntax for various spike, . bar, and region settings. . let x = sequence 1 1 9 let y = x**2 . . Generate plot standard way . xlimits 0 10 plot y x 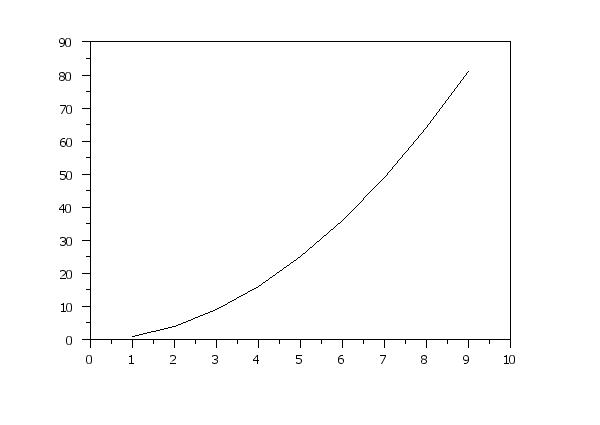
. . Now test spike settings . let plot line 1 = blank let plot spike 1 = on let plot spike thickness 1 = 0.3 let plot spike color 1 = red let plot spike base 1 = -5 plot y x let plot spike 1 = off let plot spike thickness 1 = 0.1 let plot spike color 1 = black let plot spike base 1 = 0 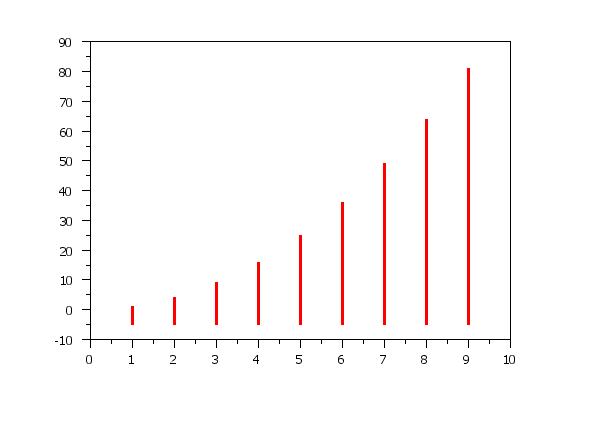
. . Now test bar settings - solid fill . let plot bar 1 = on let plot bar base 1 = -5 let plot bar width 1 = 0.5 let plot bar fill 1 = on let plot bar fill color 1 = blue let plot bar border color 1 = red let plot bar border thick 1 = 0.3 plot y x let plot bar 1 = off let plot bar base 1 = 0 let plot bar width 1 = 1 let plot bar fill 1 = off let plot bar fill color 1 = black let plot bar border color 1 = black let plot bar border thick 1 = 0.1 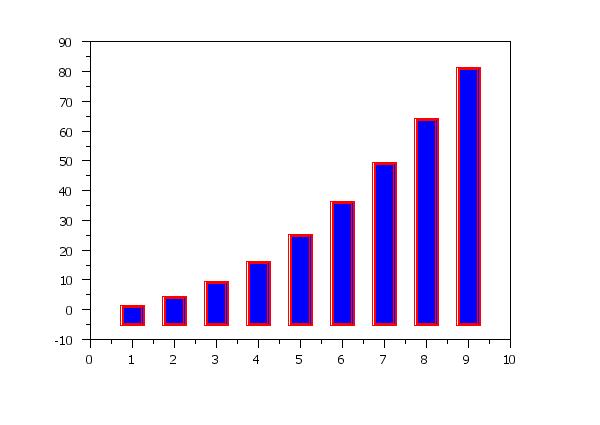
. . Now test bar settings - pattern fill . let plot bar 1 = on let plot bar fill 1 = on let plot bar base 1 = -5 let plot bar width 1 = 0.8 let plot bar pattern 1 = d1 let plot bar pattern colo 1 = red let plot bar pattern thic 1 = 0.3 let plot bar pattern spac 1 = 3 plot y x let plot bar 1 = off let plot bar fill 1 = off let plot bar base 1 = 0 let plot bar width 1 = 1 let plot bar pattern 1 = blank let plot bar pattern colo 1 = black let plot bar pattern thic 1 = 0.1 let plot bar pattern spac 1 = 1 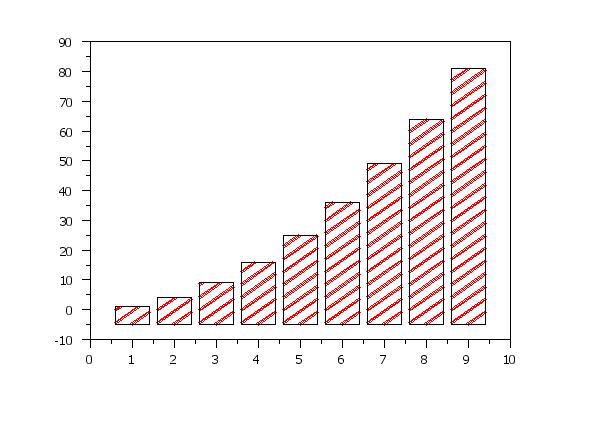
. . Now test region settings - solid fill . y1tic mark offset 10 0 let plot line 1 = solid let plot region fill 1 = on let plot region fill color 1 = blue let plot region base 1 = -5 plot y x let plot region fill 1 = off let plot region fill color 1 = black let plot region base 1 = 0 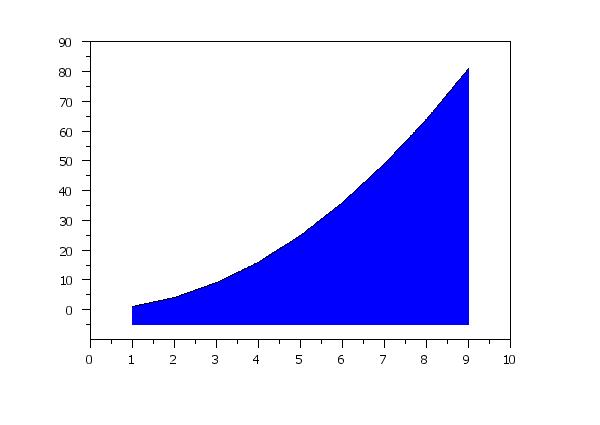
.
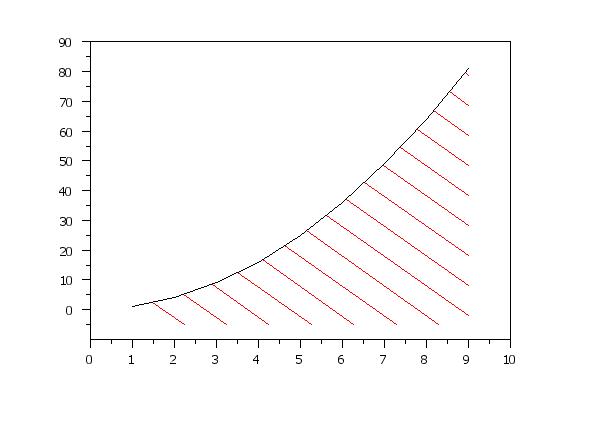
. Now test region settings - pattern fill
.
y1tic mark offset 10 0
let plot line 1 = solid
let plot region fill 1 = on
let plot region pattern 1 = d2
let plot region pattern colo 1 = red
let plot region pattern spac 1 = 5
let plot region pattern thic 1 = 0.2
let plot region base 1 = -5
plot y x
let plot region fill 1 = off
let plot region pattern 1 = blank
let plot region pattern colo 1 = black
let plot region pattern spac 1 = 1
let plot region pattern thic 1 = 0.1
let plot region base 1 = 0
|
Privacy
Policy/Security Notice
NIST is an agency of the U.S.
Commerce Department.
Date created: 08/14/2014 | ||||||||||||||