
|
|
STREAM READName:
With the advent of "big data", there are more data files that cannot be read into Dataplot's available memory. For these data files, there are several things that can potentially be done
where <file> is the name of the file to read; and where <x1>, <x2>, ... <xk> is a list of variables to read. This version of the command is used to read the input file and to write a new version of the data using a specified Fortran-like format. This command is useful in the following way. Large data files can take a long time to read. If you can use the SET READ FORMAT command to read the data, this can significantly speed up the reading of the data. For example, reading the data set used by the example programs below used 24.7 cpu seconds on a Linux machine running CentOS. Performing the same read on the same platform with a SET READ FORMAT required 0.6 cpu seconds. Cpu times will vary depending on the hardware and operating system, but this is indicative of the relative performance improvement that can be obtained by using the SET READ FORMAT command. This example file is not particularly large (361,920 rows). The speed improvement becomes even more important when we start dealing with multiple millions of rows. Often large data sets will initially not be in a format where the SET READ FORMAT can be used. So this command can be used once, with the SET WRITE FORMAT command, to create a new version of the file that is formatted in a way that the SET READ FORMAT can be used (see the first example under Examples:). This new file is then used for subsequent Dataplot sessions that use this data.
where <stat> is one of Dataplot's supported univariate statistics; <file> is the name of the file to read; and where <x1>, <x2>, ... <xk> is a list of variables to read. This syntax will read the file a user-specified number of rows at a time. It will then replace those rows with the specified statistic. That is, the original data will be replaced with the specified statistic for fixed intervals of the data. For example, you can read 1,000 rows, compute (and save) the mean for those 1,000 rows for each variable, then repeat for the next 1,000 rows. That is, the original data will be replaced with the means of fixed intervals of the data. To specify the number of rows to read at a time, enter
Alternatively, you can specify one of the variabes to define the group (i.e., when the value of the specified variable changes, this denotes the start of a new group). For this option, enter
This capability is motivated by the desire to handle large data sets that may exceed Dataplot's storage limits. This command allows you to compute some basic statistics (mean, minimum, maximum, standard deviation, and so on) for slices of the data. Often, some useful exploratory analysis can be performed on this compressed data. To see a list of supported univariate statistics, enter
where <file> is the name of te file to read; and where <x1>, <x2>, ... <xk> is a list of variables to read. This is a variant of Syntax 2 that allows a default set of statistics to be computed on a single pass of the data. This computes the statistic for slices of the data as in Syntax 2 (it uses the SET STREAM READ SIZE and SET STREAM READ GROUP VARIABLE commands as in Syntax 2). The following statistics are computed:
For this syntax, a tag variable (TAGSTAT) will be created that defines the statistic (i.e., each row of TAGSTAT contains a value from 1 to 21). TAGSTAT can be used to exract the desired statistic for each group. If a group variable was specified, that variable will contain the group-id. For example, if X is the group id variable and it has 3 groups with values of 1, 2, and 3, then the X will have a value of 1 in rows 1 to 21, a value of 2 in rows 22 to 42, and a value of 3 in rows 43 to 63.
where <file> is the name of the file to read; and where <x1>, <x2>, ... <xk> is a list of variables to read. This syntax will compute the following statistics using 1-pass algorithms for all of the data:
Each of the <x1> ... <xk> will have 8 rows containing the above eight statistics for each column read.
where <file> is the name of the file to read; and where <x1>, <x2>, ... <xk> is a list of variables to read. This is similar to syntax 4. However, instead of computing the statistics for the full data set, it will compute them for cross tabulations of the data. You can specify from one to four cross-tabulation variables with the commands
SET STREAM READ CROSS TABULATE VARIABLE TWO <name> SET STREAM READ CROSS TABULATE VARIABLE THREE <name> SET STREAM READ CROSS TABULATE VARIABLE FOUR <name> With this syntax, the following nine statistics will be computed for each cross-tabulation cell
For this syntax, a tag variable (TAGSTAT) will be created that defines the statistic (i.e., each row of TAGSTAT contains a value from 1 to 9). TAGSTAT can be used to exract the desired statistic for each group. For each cell, 9 rows will be generated. The variables defined as cross tabulation variables will simply have their value for that cell for all 9 rows. For the variables that are not defined as cross tabulation variables, the 9 rows will contain the values of the above 9 statistics.
where <file> is the name of the file to read; <metric> is one of the measures defined below; and where <x1>, <x2>, ... <xk> is a list of variables to read. With this option, the STREAM READ will return a distance, similarity, covariance, or correlation matrix. The raw data is not saved. For example,
will return the 3 variables Y1, Y2, and Y3 where each of these variables will contain 3 rows. For example, Y2(3) contains the correlation between the second response column and the third response column. The <metric> option can be any of the following
MANHATTAN DISTANCE CHEBYCHEV DISTANCE CANBERRA DISTANCE HAMMING DISTANCE COSINE DISTANCE COSINE SIMILARITY ANGULAR COSINE DISTANCE ANGULAR COSINE SIMILARITY COVARIANCE CORRELATION This syntax will ignore character fields. If you do not want some fields in the file to be included, you can do something like the following
SET STREAM READ VARIABLE TYPE ITYPE These commands specify that fields 1, 2, 3, and 5 will be included while field 4 will be excluded. This can be useful if some of the fields are categorical variables where distance and covariance/correlation do not make sense.
where <file> is the name of the file to read; <metric> is one of measures specified in Syntax 6; and where <x1>, <x2>, ... <xk> is a list of variables to read. This is similar to Syntax 6. However, the metric will be computed separately for each cross tabulation cell. The cross tabulation variables are specified as in Syntax 5. This syntax also creates a TAGSTAT variable. However, in this case the TAGSTAT variable is the "cell id" value. For each cell, the number of rows generated will be equal to the number of columns used to compute the distance metric (i.e., the cross tabulation variables or variables omitted by the SET STREAM READ VARIABLE TYPE command). The variables defined as cross tabulation variables will simply have their value for that cell for all the rows.
where <file> is the name of the file to read; and where <x1>, <x2>, ... <xk> is a list of variables to read. This syntax will replace the raw data with a user-specified number of approximate percentiles. To specify the number of equally spaced percentiles to generate, enter the command
where <value> is one of 9, 99, 999, or 9999. The default is 999. The minimum and maximum values are also saved. So if the number of percentiles is 999, 1001 points will be returned. Dataplot uses the extended P2 algorithm (the P2 algorithm was originally proposed by Jain and Chlamtac and was extended for multiple percentiles by Raatikanien). This algorithm requires 2*m+3 points where m is the desired number of percentiles. So if the number of values read is less than or equal to 2*m+3, Dataplot returns the original data (in sorted order). If the number of points is greater than this, then the approximate percentiles are returned.
where <file> is the name of the file to read; and where <x1>, <x2>, ... <xk> is a list of variables to read. This is similar to Syntax 8. However, the percentiles will be computed separately for each cross tabulation cell. The cross tabulation variables are specified as in Syntax 5. This syntax also creates a TAGSTAT variable. However, in this case the TAGSTAT variable is the "cell id" value. For each cell, the number of rows generated will be equal to the number of percentiles requested. The variables defined as cross tabulation variables will simply have their value for that cell for all the rows.
STREAM READ WRITE BIG.DAT X1 TO X10
SET STREAM READ SIZE 100
STREAM READ FULL STATISTICS BIG.DAT X1 TO X10
Raatikanien (1987), "Simultaneous Estimation of Several Percentiles," Simulation, pp. 159-164.
2018/07: Interpret character variables as categorical numeric variables for the WRITE and CROSS TABULATE cases 2018/07: Support for CROSS TABULATION 2018/07: Omit missing values when computing statistics 2018/07: Option to automatically create group labels from character data 2018/07: Allow specification of a "row label" column 2018/07: Support for DISTANCE metrics 2018/08: Support for CROSS TABULATION for DISTANCE metrics 2018/08: Support for PERCENTILE and CROSS TABULATE PERCENTILE
. Step 1: Demonstrate the group statistic option of stream read
.
skip 25
set read format 3F7.0
set stream read group variable rowid
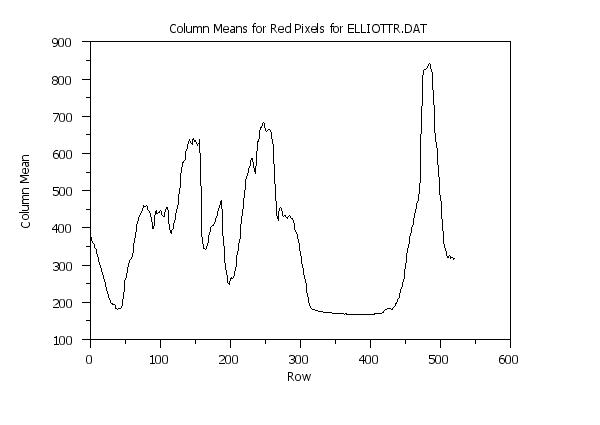
stream read group statistics mean elliottr.dat redcolme rowid colid
.
. Step 2: Generate plot of column means
.
title offset 2
title case asis
label case asis
.
title Column Means for Red Pixels for ELLIOTTR.DAT
y1label Column Mean
x1label Row
.
plot redcolme vs rowid
.
. Step 3: Reset read settings
.
skip 0
set read format
 Program 2:
. Step 1: Demonstrate the default statistic option of stream read
.
skip 25
set read format 3F7.0
set stream read group variable rowid
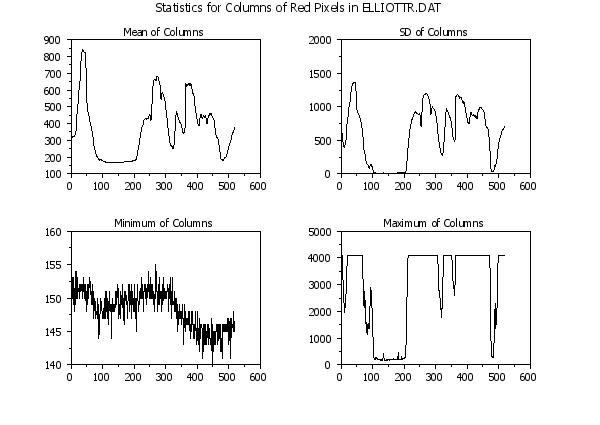
stream read default statistics elliottr.dat red rowid colid
.
let redmean = red
retain redmean subset tagstat = 6
let redsd = red
retain redsd subset tagstat = 7
let redmin = red
retain redmin subset tagstat = 4
let redmax = red
retain redmax subset tagstat = 5
.
. Step 2: Plot some of the statistics
.
multiplot corner coordinates 5 5 95 95
multiplot scale factor 2
multiplot 2 2
.
label case asis
title case asis
case asis
title offset 2
.
title Mean of Columns
plot redmean
.
title SD of Columns
plot redsd
.
title Minimum of Columns
plot redmin
.
title Maximum of Columns
plot redmax
.
end of multiplot
.
justification center
move 50 97
text Statistics for Columns of Red Pixels in ELLIOTTR.DAT
.
. Step 2: Reset read settings
.
skip 0
set read format
 Program 3:
. Step 1:   Demonstrate the default statistic option of stream read
.
skip 25
set read format 3F7.0
stream read full statistics elliottr.dat red rowid colid
.
. Step 2:   Print statistics for red variable
.
feedback off
set write decimals 2
print "Statistics for variable RED:"
print " "
print " "
let aval = red(1)
print "Size:      ^aval"
let aval = red(2)
print "Minimum:   ^aval"
let aval = red(3)
print "Maximum:   ^aval"
let aval = red(4)
let aval = round(aval,2)
print "Mean:      ^aval"
let aval = red(5)
let aval = round(aval,2)
print "SD:        ^aval"
let aval = red(6)
let aval = round(aval,2)
print "Skewness:  ^aval"
let aval = red(7)
let aval = round(aval,2)
print "Kurtosis:  ^aval"
let aval = red(8)
print "Range:     ^aval"
feedback on
.
. Step 3:   Reset read settings
.
skip 0
set read format
Statistics for variable RED:


Size:      361920
Minimum:   140
Maximum:   4095
Mean:      369.38
SD:        745.5
Skewness:  4.23
Kurtosis:  20
Range:     3955
Program 4:
set write decimals 4
set read missing value -999
let itype = data 1 1 1 1 0
set stream read variable type itype
set stream read cross tabulate variable one groupid
.
skip 25
stream read cross tabulate iris.dat y1 y2 y3 y4 groupid
print y1 y2 y3 y4 groupid tagstat
The following output is returned
------------------------------------------------------------------------------------------
             Y1             Y2             Y3             Y4        GROUPID        TAGSTAT
------------------------------------------------------------------------------------------
        50.0000        50.0000        50.0000        50.0000         1.0000         1.0000
         4.3000         2.3000         0.0000         0.1000         1.0000         2.0000
         5.8000         4.4000         0.9000         0.6000         1.0000         3.0000
         1.5000         2.1000         0.9000         0.5000         1.0000         4.0000
         5.0060         3.4280         0.4620         0.2460         1.0000         5.0000
         0.3525         0.3791         0.1737         0.1054         1.0000         6.0000
         0.1165         0.0399         0.1032         1.2159         1.0000         7.0000
         2.6542         3.7442         3.8046         4.4343         1.0000         8.0000
         0.0000         0.0000         0.0000         0.0000         1.0000         9.0000
        50.0000        50.0000        50.0000        50.0000         2.0000         1.0000
         4.9000         2.0000         3.0000         0.0000         2.0000         2.0000
         7.0000         3.4000         5.1000         0.8000         2.0000         3.0000
         2.1000         1.4000         2.1000         0.8000         2.0000         4.0000
         5.9360         2.7700         4.2600         0.3260         2.0000         5.0000
         0.5162         0.3138         0.4699         0.1978         2.0000         6.0000
         0.1022        -0.3519        -0.5882        -0.0302         2.0000         7.0000
         2.4012         2.5517         2.9256         2.5122         2.0000         8.0000
         0.0000         0.0000         0.0000         0.0000         2.0000         9.0000
        50.0000        50.0000        50.0000        50.0000         3.0000         1.0000
         4.9000         2.2000         4.5000         1.4000         3.0000         2.0000
         7.9000         3.8000         6.9000         2.5000         3.0000         3.0000
         3.0000         1.6000         2.4000         1.1000         3.0000         4.0000
         6.5880         2.9740         5.5520         2.0260         3.0000         5.0000
         0.6359         0.3225         0.5519         0.2747         3.0000         6.0000
         0.1144         0.3549         0.5328        -0.1256         3.0000         7.0000
         2.9121         3.5198         2.7435         2.3387         3.0000         8.0000
         0.0000         0.0000         0.0000         0.0000         3.0000         9.0000
Program 5:
set write decimals 4
set read missing value -999
let itype = data 1 1 1 1 0
set stream read variable type itype
skip 25
.
.  Options to pick which distance/similarity metric to compute
. let iflag1 = 1
let iflag1 = 2
let iflag2 = 1
. let iflag2 = 2
. let iflag2 = 3
. let iflag2 = 4
. let iflag2 = 5
. let iflag2 = 6
. let iflag2 = 7
. let iflag2 = 8
. let iflag2 = 9
. let iflag2 = 10
. let iflag2 = 11
.
if iflag1 = 1
   if iflag2 = 1
      stream read covariance iris.dat y1 y2 y3 y4
   else if iflag2 = 2
      stream read correlation iris.dat y1 y2 y3 y4
   end of if
else if iflag1 = 2
   if iflag2 = 1
      stream read euclidean distance iris.dat y1 y2 y3 y4
   else if iflag2 = 2
      stream read manhattan distance iris.dat y1 y2 y3 y4
   else if iflag2 = 3
      stream read chebychev distance iris.dat y1 y2 y3 y4
   else if iflag2 = 4
      stream read cosine distance iris.dat y1 y2 y3 y4
   else if iflag2 = 5
      stream read cosine similarity iris.dat y1 y2 y3 y4
   else if iflag2 = 6
      stream read angular cosine distance iris.dat y1 y2 y3 y4
   else if iflag2 = 7
      stream read angular cosine similarity iris.dat y1 y2 y3 y4
   else if iflag2 = 8
      let v = jaccard column similarity x
      stream read jaccard similarity iris.dat y1 y2 y3 y4
   else if iflag2 = 9
      stream read jaccard distance iris.dat y1 y2 y3 y4
   else if iflag2 = 10
      stream read hamming distance iris.dat y1 y2 y3 y4
   else if iflag2 = 11
      stream read canberra distance iris.dat y1 y2 y3 y4
   end of if
end of if
.
print y1 y2 y3 y4
The following output is returned
------------------------------------------------------------
             Y1             Y2             Y3             Y4
------------------------------------------------------------
         0.0000        36.1578        35.2624        61.4890
        36.1578         0.0000        30.1846        29.3828
        35.2624        30.1846         0.0000        37.6646
        61.4890        29.3828        37.6646         0.0000
Program 6:
set write decimals 4
set read missing value -999
set stream read cross tabulate variable one groupid
let itype = data 1 1 1 1 0
set stream read variable type itype
skip 25
.
.  Options to select which distance metric to use
.
. let iflag1 = 1
let iflag1 = 2
let iflag2 = 1
. let iflag2 = 2
. let iflag2 = 3
. let iflag2 = 4
. let iflag2 = 5
. let iflag2 = 6
. let iflag2 = 7
. let iflag2 = 8
. let iflag2 = 9
. let iflag2 = 10
. let iflag2 = 11
.
if iflag1 = 1
   if iflag2 = 1
      stream read cross tabulate covariance iris.dat y1 y2 y3 y4 groupid
   else if iflag2 = 2
      stream read cross tabulate correlation iris.dat y1 y2 y3 y4 groupid
   end of if
else if iflag1 = 2
   if iflag2 = 1
      stream read cross tabulate euclidean distance iris.dat y1 y2 y3 y4 groupid
   else if iflag2 = 2
      stream read cross tabulate manhattan distance iris.dat y1 y2 y3 y4 groupid
   else if iflag2 = 3
      stream read cross tabulate chebychev distance iris.dat y1 y2 y3 y4 groupid
   else if iflag2 = 4
      stream read cross tabulate cosine distance iris.dat y1 y2 y3 y4 groupid
   else if iflag2 = 5
      stream read cross tabulate cosine similarity iris.dat y1 y2 y3 y4 groupid
   else if iflag2 = 6
      stream read cross tabulate angular cosine distance iris.dat y1 y2 y3 y4 groupid
   else if iflag2 = 7
      stream read cross tabulate angular cosine similarity iris.dat y1 y2 y3 y4 groupid
   else if iflag2 = 8
      stream read cross tabulate jaccard similarity iris.dat y1 y2 y3 y4 groupid
   else if iflag2 = 9
      stream read cross tabulate jaccard distance iris.dat y1 y2 y3 y4 groupid
   else if iflag2 = 10
      stream read cross tabulate hamming distance iris.dat y1 y2 y3 y4 groupid
   else if iflag2 = 11
      stream read cross tabulate canberra distance iris.dat y1 y2 y3 y4 groupid
   end of if
end of if
.
print y1 y2 y3 y4 groupid tagstat
The following output is returned
 ------------------------------------------------------------------------------------------
              Y1             Y2             Y3             Y4        GROUPID        TAGSTAT
 ------------------------------------------------------------------------------------------
          0.0000        11.3097        32.2236        33.7417         1.0000         1.0000
         11.3097         0.0000        21.1478        22.6480         1.0000         1.0000
         32.2236        21.1478         0.0000         1.9391         1.0000         1.0000
         33.7417        22.6480         1.9391         0.0000         1.0000         1.0000
          0.0000        22.5989        12.0996        39.7883         2.0000         2.0000
         22.5989         0.0000        10.8881        17.3597         2.0000         2.0000
         12.0996        10.8881         0.0000        27.9176         2.0000         2.0000
         39.7883        17.3597        27.9176         0.0000         2.0000         2.0000
          0.0000        25.8606         7.6603        32.5467         3.0000         3.0000
         25.8606         0.0000        18.5831         7.0043         3.0000         3.0000
          7.6603        18.5831         0.0000        25.2085         3.0000         3.0000
         32.5467         7.0043        25.2085         0.0000         3.0000         3.0000
|
Privacy
Policy/Security Notice
NIST is an agency of the U.S.
Commerce Department.
Date created: 07/24/2017 | |||||||||||||||||||||||||||||||||||||