|
|
COEFFICIENT OF VARIATIONName:
where s is the sample standard deviation and \( \bar{x} \) is the sample mean. That is, it shows the variability, as defined by the standard deviation, relative to the mean. The coefficient of variation should typically only be used for data measured on a ratio scale. That is, the data should be continuous and have a meaningful zero. Measurement data in the physical sciences and engineering are often on a ratio scale. As an example, temperatures measured on a Kelvin scale are on a ratio scale while temperaturs measured on a Celcius or Farenheit scale are interval scales rather than ratio scales. Given a set of temperature measurements, the coefficient of variation on the Celcius scale will be different than the coefficient of variation on the Farenheit scale. The coefficient of variation is sometimes preferred to the standard deviation because the value of the coefficient of variation is independent of the unit of measurement scale (as long as it is a ratio scale). When comparing variability between data sets with different measurement scales or very different mean values, the coefficient of variation can be a useful alternative or complement to the standard deviation. However, the coefficient of variation should not be used for data that are not on a ratio scale. Also, if the mean value is near zero, the coefficient of variation is sensitive to small changes in the mean. Also, the coefficient of variation cannot be used to compute confidence intervals for the mean.
<SUBSET/EXCEPT/FOR qualification> where <y> is a response variable; <par> is a parameter where the coefficient of variation value is saved; and where the <SUBSET/EXCEPT/FOR qualification> is optional.
<SUBSET/EXCEPT/FOR qualification> where <y> is a response variable; <par> is a parameter where the unbiased coefficient of variation value is saved; and where the <SUBSET/EXCEPT/FOR qualification> is optional. For normally distributed data, an unbiased estimate of the coefficient of variation is
where n is the sample size and cv is \( s/\bar{x} \).
<SUBSET/EXCEPT/FOR qualification> where <y> is a response variable; <par> is a parameter where the lognormal coefficient of variation value is saved; and where the <SUBSET/EXCEPT/FOR qualification> is optional. For lognormally distributed data, a more accurate estimate for the coefficient of variation (based on the population mean and standard deviation of the lognormal distribution) is
where \( s_{\mbox{ln}}^2 \) is the variance of the log of the data.
LET CV = COEFFICIENT OF VARIATION Y1 SUBSET TAG > 2 LET CV = UNBIASED COEFFICIENT OF VARIATION Y1 LET CV = LOGNORMAL COEFFICIENT OF VARIATION Y1
That is, the relative standard deviation is the absolute value of the coefficient of variation expressed in percentage units.
2017/01 Added the UNBIASED COEFFICIENT OF VARIATION 2017/01 Added the LOGNORMAL COEFFICIENT OF VARIATION
LET Y1 = NORMAL RANDOM NUMBERS FOR I = 1 1 100
LET CV = COEFFICIENT OF VARIATION Y1
Program 2:
. Step 1: Create the data
.
skip 25
read gear.dat y x
skip 0
set write decimals 6
.
. Step 2: Define plot control
.
title case asis
title offset 2
label case asis
.
y1label Coefficient of Variation
x1label Group
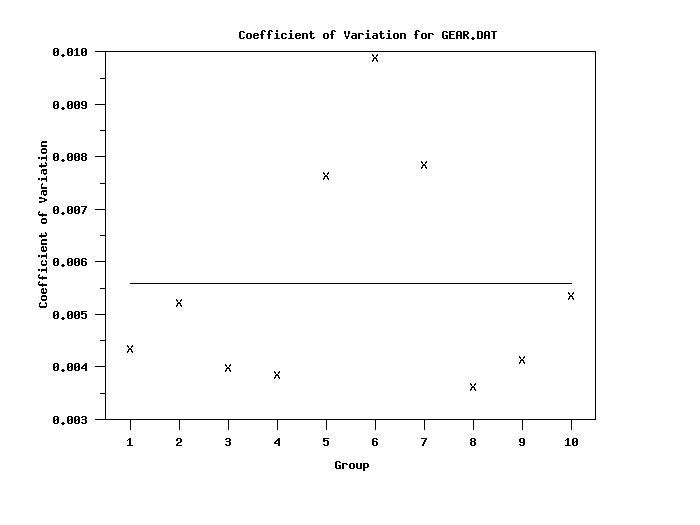
title Coefficient of Variation for GEAR.DAT
let ngroup = unique x
xlimits 1 ngroup
major x1tic mark number ngroup
minor x1tic mark number 0
tic mark offset units data
x1tic mark offset 0.5 0.5
y1tic mark label decimals 3
.
character X
line blank
.
set statistic plot reference line average
.
coefficient of variation plot y x
| |||||||||||||||||||||||