|
|
DIFFERENCE OF PERCENTAGE BEND MIDVARIANCEName:
The percentage bend midvariance of a a variable X is computed as follows:
The value of \( \beta \) is selected between 0 and 0.5. Higher values of \( \beta \) is selected result in a higher breakdown point at the expense of lower efficiency. For the differeence of percentage bend midvariances, the percentage bend midvariance is computed for each of two samples then their difference is taken.
<SUBSET/EXCEPT/FOR qualification> where <y1> is the first response variable; <y2> is the first response variable; <par> is a parameter where the computed difference of the percentage bend midvariances is stored; and where the <SUBSET/EXCEPT/FOR qualification> is optional.
LET A = DIFFERENCE OF PERCENTAGE BEND MIDVARIANCE Y1 Y2 SUBSET X > 1
where
Rand Wilcox (1997), "Introduction to Robust Estimation and Hypothesis Testing," Academic Press. Mosteller and Tukey (1977), "Data Analysis and Regression: A Second Course in Statistics," Addison-Wesley, pp. 203-209.
SKIP 25
READ IRIS.DAT Y1 TO Y4 X
.
LET A = DIFFERENCE OF PERCENTAGE BEND MIDVARIANCE Y1 Y2
TABULATE DIFFERENCE OF PERCENTAGE BEND MIDVARIANCE Y1 Y2 X
.
XTIC OFFSET 0.2 0.2
X1LABEL GROUP ID
Y1LABEL DIFFERENCE OF PERCENTAGE BEND MIDVARIANCE
CHAR X
LINE BLANK
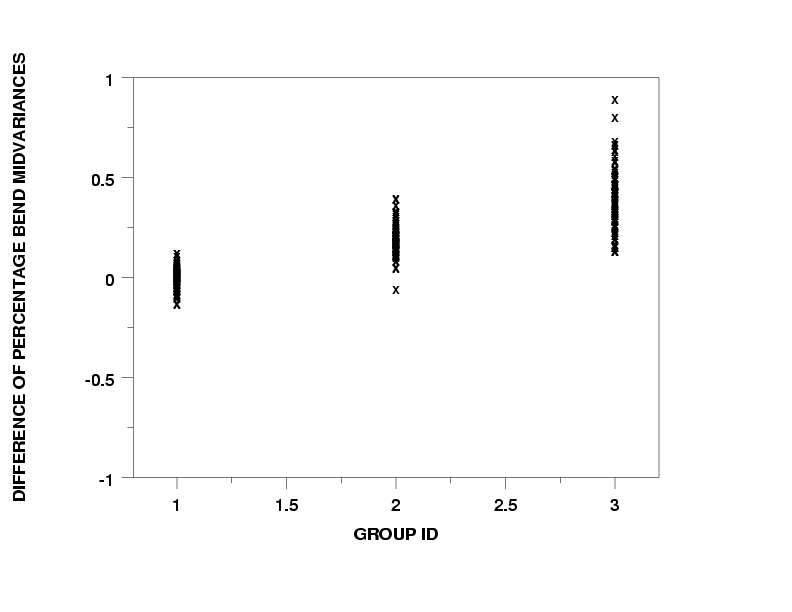
DIFFERENCE OF PERCENTAGE BEND MIDVARIANCE PLOT Y1 Y2 X
CHAR X ALL
LINE BLANK ALL
BOOTSTRAP DIFFERENCE OF PERCENTAGE BEND MIDVARIANCE PLOT Y1 Y2 X
Dataplot generated the following output.
       ***************************************************************
       **  LET A = DIFFERENCE OF PERCENTAGE BEND MIDVARIANCE Y1 Y2  **
       ***************************************************************


 THE COMPUTED VALUE OF THE CONSTANT A             =  0.51659620E+00


       ******************************************************************
       **  TABULATE DIFFERENCE OF PERCENTAGE BEND MIDVARIANCE Y1 Y2 X  **
       ******************************************************************


                 *    Y1       AND Y2
     X           *    DIFFERENCE OF PERCENTAGE BEND MIDVARIANC
 **********************************************
     1.00000     *    0.153299E-01
     2.00000     *    0.201068
     3.00000     *    0.370212

       GROUP-ID AND STATISTIC WRITTEN TO FILE DPST1F.DAT

|
Privacy
Policy/Security Notice
NIST is an agency of the U.S.
Commerce Department.
Date created: 03/27/2003 | ||||||||||||||||||||||||||