SED navigation bar go to SED home page go to Dataplot home page go to NIST home page SED Home Page SED Staff SED Projects SED Products and Publications Search SED Pages
Dataplot Vol 2 Vol 1

H15

Name:
    H15 (LET)
Type:
    Let Subcommand
Purpose:
    Compute the H15 robust location or scale estimate of a variable.
Description:
    The H15 location and scale estimates are computed as follows.

    Let X = x1, x2, ..., xp denote the response values and x* and s* denote the robust estimates of location and scale, respectively. The initial estimate for x* is the median. The initial estimate for s* is

      s* = MAD(X)/0.6745

    where MAD is the median absolute deviation.

    To update the values for x* and s*, calculate

      \( \delta \) = c s*

      \( \begin{array}{lcll} x_{i}^{*} & = & x^{*} - \delta \hspace{10pt} & \mbox{if } x_{i} < x^{*} - \delta \\ & = & x^{*} + \delta \hspace{10pt} & \mbox{if } x_{i} > x^{*} + \delta \\ & = & x_{i} \hspace{10pt} & \mbox{otherwise} \end{array} \)

    The updated values of x* and s* are

      \( x^{*} = \frac{\sum_{i=1}^{p}{x_{i}}} {p} \)

      \( s^{*} = \frac{1} {\beta^2} \sqrt{\frac{\sum_{i=1}^{p}{(x_i^{*} - x^{*})^2}} {p - 1}} \)

    This process is iterated until the values of x* and s* converge.

    For H15, c = 1.5 and \( \beta \) = 0.778. There are several alternative estimates that use different values for c and \( \beta \). Specifically,

    • H10: c= 1.0 and \( \beta \) = 0.516
    • H12: c= 1.1 and \( \beta \) = 0.578
    • H12: c= 1.2 and \( \beta \) = 0.635
    • H13: c= 1.3 and \( \beta \) = 0.688
    • H14: c= 1.4 and \( \beta \) = 0.736
    • H16: c= 1.6 and \( \beta \) = 0.816
    • H17: c= 1.7 and \( \beta \) = 0.849
    • H18: c= 1.8 and \( \beta \) = 0.877
    • H19: c= 1.9 and \( \beta \) = 0.900
    • H20: c= 2.0 and \( \beta \) = 0.921

    Dataplot currently supports the H10, H12, H15, H17, H20 variations of this command. The H15 variant is the most commonly used.

    In the ISO 5725-5 and ISO 13528 standards, H15 is referred to as "Algorithm A".

Syntax 1:
    LET <par> = <stat> LOCATION <y>
                            <SUBSET/EXCEPT/FOR qualification>
    where <y> is the response variable;
                <stat> is one of H10, H12, H15, H17, H20;
                <par> is a parameter where the computed location value is saved;
    and where the <SUBSET/EXCEPT/FOR qualification> is optional.
Syntax 2:
    LET <par> = <stat> SCALE <y>
                            <SUBSET/EXCEPT/FOR qualification>
    where <y> is the response variable;
                <stat> is one of H10, H12, H15, H17, H20;
                <par> is a parameter where the computed scale value is saved;
    and where the <SUBSET/EXCEPT/FOR qualification> is optional.
Examples:
    LET ALOC = H15 LOCATION Y
    LET ASCALE = H15 SCALE Y
    LET ALOC = H15 LOCATION Y SUBSET Y > 0
    LET ALOC = H20 LOCATION Y
Note:
    Dataplot uses the Ripley algorithm to compute these statistics.
Note:
    This method is referred to as Algorithm A in the ISO 13528 standard. The description of the algorithm is taken from that standard.
Note:
    Dataplot statistics can be used in a number of commands. For details, enter

Default:
    None
Synonyms:
    None
Related Commands:
    MEAN = Compute the mean of a variable.
    MEDIAN = Compute the median of a variable.
    RANGE = Compute the range of a variable.
    VARIANCE = Compute the variance of a variable.
    STANDARD DEVIATION = Compute the standard deviation of a variable.
    MAD = Compute the median absolute deviation of a variable.
    HOMOSCEDASTICITY PLOT = Generate a homoscedasticity plot.
Applications:
    Data Analysis, Proficiency Analysis
Reference:
    Analytical Methods Committee, "Robust Statistics--How Not to Reject Outliers: Part 1. Basic Concepts", Analyst, December 1989, Vol. 1.

    ISO 13528 (2005), "Statistical Methods for use in proficiency testing by interlaboratory comparisons," Section C.2 Algorithm S.

Implementation Date:
    2010/12
Program:
     
    SKIP 25
    READ GEAR.DAT Y X
    LET A = H15 LOCATION Y
    .
    LABEL CASE ASIS
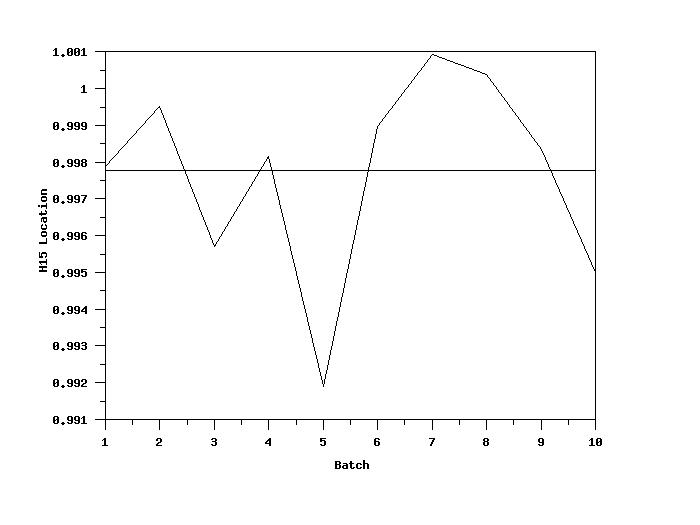
    Y1LABEL H15 Location
    X1LABEL Batch
    H15 LOCATION PLOT Y X
    .
    LET A = H15 LOCATION Y
    SET WRITE DECIMALS 4
    SET LET CROSS TABULATE COLLAPSE
    LET XGROUP = CROSS TABULATE GROUP ONE X
    LET YMEAN = CROSS TABULATE H15 LOCATION Y X
    LET YSD   = CROSS TABULATE H15 SCALE    Y X
    PRINT XGROUP YMEAN YSD
        
    The following output is generated.
    ---------------------------------------------
             XGROUP          YMEAN            YSD
    ---------------------------------------------
             1.0000         0.9978         0.0046
             2.0000         0.9995         0.0048
             3.0000         0.9957         0.0037
             4.0000         0.9981         0.0042
             5.0000         0.9919         0.0085
             6.0000         0.9989         0.0108
             7.0000         1.0009         0.0075
             8.0000         1.0003         0.0041
             9.0000         0.9983         0.0045
            10.0000         0.9950         0.0046
        
    plot generated by sample program

Privacy Policy/Security Notice
Disclaimer | FOIA

NIST is an agency of the U.S. Commerce Department.

Date created: 01/06/2011
Last updated: 11/16/2015

Please email comments on this WWW page to alan.heckert@nist.gov.