
|
|
LEXPDFName:
 . .
with This distribution can be generalized with location and scale parameters in the usual way using the relation
with
<SUBSET/EXCEPT/FOR qualification> where <x> is a number, parameter, or variable; <y> is a variable or a parameter (depending on what <x> is) where the computed logistic-exponential pdf value is stored; <beta> is a number, parameter, or variable that specifies the shape parameter; <loc> is a number, parameter, or variable that specifies the location parameter; <scale> is a positive number, parameter, or variable that specifies the scale parameter; and where the <SUBSET/EXCEPT/FOR qualification> is optional. If <loc> and <scale> are omitted, they default to 0 and 1, respectively.
LET Y = LEXPDF(X,0.5,0,5) PLOT LEXPDF(X,0.7,0,3) FOR X = 0 0.01 5
LET Y = LOGISTIC EXPONENTIAL RANDOM NUMBERS FOR I = 1 1 N LOGISTIC EXPONENTIAL PROBABILITY PLOT Y LOGISTIC EXPONENTIAL PROBABILITY PLOT Y2 X2 LOGISTIC EXPONENTIAL PROBABILITY PLOT Y3 XLOW XHIGH LOGISTIC EXPONENTIAL KOLMOGOROV SMIRNOV ... GOODNESS OF FIT Y LOGISTIC EXPONENTIAL CHI-SQUARE GOODNESS OF FIT Y2 X2 LOGISTIC EXPONENTIAL CHI-SQUARE GOODNESS OF FIT ... Y3 XLOW XHIGH The following commands can be used to estimate the beta shape parameter for the logistic-exponential distribution:
LET BETA2 = <value> LOGISTIC EXPONENTIAL PPCC PLOT Y LOGISTIC EXPONENTIAL PPCC PLOT Y2 X2 LOGISTIC EXPONENTIAL PPCC PLOT Y3 XLOW XHIGH LOGISTIC EXPONENTIAL KS PLOT Y LOGISTIC EXPONENTIAL KS PLOT Y2 X2 LOGISTIC EXPONENTIAL KS PLOT Y3 XLOW XHIGH The default values for BETA1 and BETA2 are 0.1 and 10. The probability plot can then be used to estimate the location and scale (location = PPA0, scale = PPA1). The 2-parameter logistic-exponential maximum likelihood estimates can be obtained using the command
The maximum likelihood estimates for the full sample case are obtained as the solution of the following simultaneous equations (from Lan and Leemis):
![(n/beta) + SUM[i=1 to n][LOG(EXP(alpha*X(i)) - 1) -
2*SUM[i=1 to n][(EXP(alpha*X(I) - 1)**beta*
LOG(EXP(alpha*X(i)) -1)/{1 + (EXP(alpha*X(i)) - 1)**beta} = 0](eqns/lexml1.gif)
with If the maximum likelihood estimates do not converge to reasonable values, you can try specifying starting values with the commands
LET SCALESV = <value> For example, the estimates obtained from the ppcc plot or ks plot method can be used as starting values for the maximum likelihood. The BOOTSTRAP DISTRIBUTION command can be used to find uncertainty intervals for the ppcc plot, the ks plot, and the maximum likelihood estimates.
Lan and Leemis (2008), "The Logistic-Exponential Survival Distribution", Naval Research Logistics, to appear.
LABEL CASE ASIS
TITLE CASE ASIS
TITLE OFFSET 2
.
MULTIPLOT 2 2
MULTIPLOT CORNER COORDINATES 0 0 100 95
MULTIPLOT SCALE FACTOR 2
.
LET BETA  = 0.5
TITLE BETA = ^BETA
PLOT LEXPDF(X,BETA) FOR X = 0.01  0.01  5
.
LET BETA  = 1
TITLE BETA = ^BETA
PLOT LEXPDF(X,BETA) FOR X = 0.01  0.01  5
.
LET BETA  = 2
TITLE BETA = ^BETA
PLOT LEXPDF(X,BETA) FOR X = 0.01  0.01  5
.
LET BETA  = 5
TITLE BETA = ^BETA
PLOT LEXPDF(X,BETA) FOR X = 0.01  0.01  5
.
END OF MULTIPLOT
.
JUSTIFICATION CENTER
MOVE 50 97
TEXT Logistic-Exponential Probability Density Functions
 Program 2:
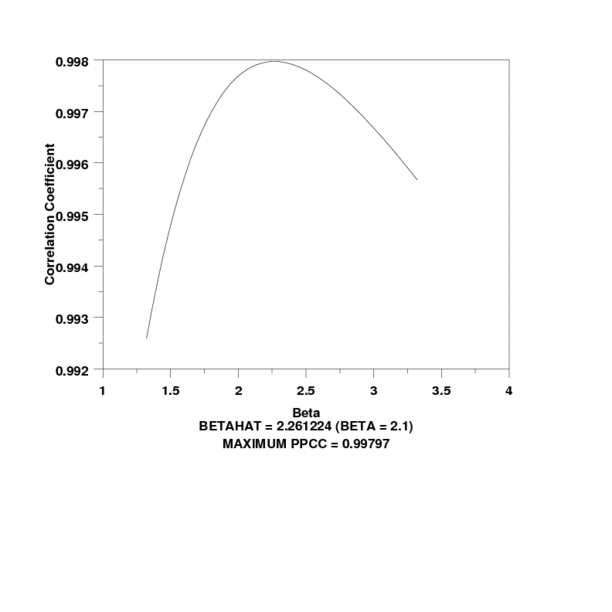
let beta = 2.1
let betasav = beta
.
let y = logistic exponential random numbers for i = 1 1 200
let y = 10*y
let amax = maximum y
.
label case asis
title case asis
.
y1label Correlation Coefficient
x1label Beta
logistic exponential ppcc plot y
let beta = shape
justification center
move 50 6
text Betahat = ^beta (BETA = ^betasav)
move 50 2
text Maximum PPCC = ^maxppcc
let beta1 = shape - 1
let beta1 = max(0.1,beta1)
let beta2 = shape + 1
logistic exponential ppcc plot y
let beta = shape
justification center
move 50 6
text Betahat = ^beta (BETA = ^betasav)
move 50 2
text Maximum PPCC = ^maxppcc
.
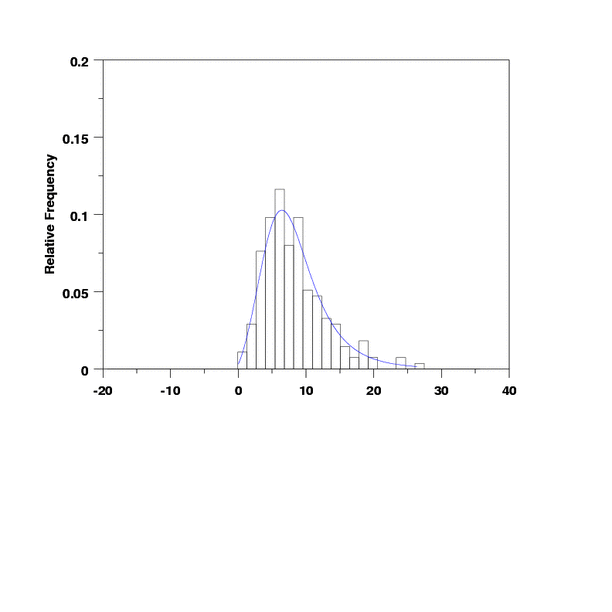
y1label Data
x1label Theoretical
char x
line bl
logistic exponential prob plot y
move 50 6
text Location = ^ppa0, Scale = ^ppa1
char bl
line so
.
y1label Relative Frequency
x1label
relative hist y
limits freeze
pre-erase off
line color blue
plot lexpdf(x,beta,ppa0,ppa1) for x = 0.01 .01 amax
line color black
limits
pre-erase on
.
let ksloc = ppa0
let ksscale = ppa1
logistic exponential kolmogorov smirnov goodness of fit y
.
logistic exponential mle y
let beta = betaml
let ksloc = 0
let ksscale = alphaml
logistic exponential kolmogorov smirnov goodness of fit y


                   KOLMOGOROV-SMIRNOV GOODNESS-OF-FIT TEST

 NULL HYPOTHESIS H0:      DISTRIBUTION FITS THE DATA
 ALTERNATE HYPOTHESIS HA: DISTRIBUTION DOES NOT FIT THE DATA
 DISTRIBUTION:            LOGISTIC-EXPONENTIAL
    NUMBER OF OBSERVATIONS              =      200

 TEST:
 KOLMOGOROV-SMIRNOV TEST STATISTIC      =   0.3711542E-01

    ALPHA LEVEL         CUTOFF              CONCLUSION
            10%       0.086*              ACCEPT H0
                      0.085**
             5%       0.096*              ACCEPT H0
                      0.095**
             1%       0.115*              ACCEPT H0
                      0.114**

     *  - STANDARD LARGE SAMPLE APPROXIMATION  ( C/SQRT(N) )
    ** - MORE ACCURATE LARGE SAMPLE APPROXIMATION  ( C/SQRT(N + SQRT(N/10)) )


       LOGISTIC-EXPONENTIAL PARAMETER ESTIMATION: FULL SAMPLE CASE
             TWO-PARAMETER MODEL (LOCATION = 0)

 SUMMARY STATISTICS:
 NUMBER OF OBSERVATIONS                            =      200
 SAMPLE MEAN                                       =    8.171047
 SAMPLE STANDARD DEVIATION                         =    4.589424
 SAMPLE MINIMUM                                    =   0.4414481
 SAMPLE MAXIMUM                                    =    26.37044

 MAXIMUM LIKELIHOOD ESTIMATES:
 SHAPE PARAMETER (BETA)                           =    2.118914
 SCALE (1/ALPHA) PARAMETER                         =    10.54572

                   KOLMOGOROV-SMIRNOV GOODNESS-OF-FIT TEST

 NULL HYPOTHESIS H0:      DISTRIBUTION FITS THE DATA
 ALTERNATE HYPOTHESIS HA: DISTRIBUTION DOES NOT FIT THE DATA
 DISTRIBUTION:            LOGISTIC-EXPONENTIAL
    NUMBER OF OBSERVATIONS              =      200

 TEST:
 KOLMOGOROV-SMIRNOV TEST STATISTIC      =   0.3192246E-01

    ALPHA LEVEL         CUTOFF              CONCLUSION
            10%       0.086*              ACCEPT H0
                      0.085**
             5%       0.096*              ACCEPT H0
                      0.095**
             1%       0.115*              ACCEPT H0
                      0.114**

     *  - STANDARD LARGE SAMPLE APPROXIMATION  ( C/SQRT(N) )
    ** - MORE ACCURATE LARGE SAMPLE APPROXIMATION  ( C/SQRT(N + SQRT(N/10)) )
Date created: 2/14/2008 |
 and
and
 denoting
the location and scale parameters, respectively.
denoting
the location and scale parameters, respectively.
![(n/alpha) + SUM[i=1 to n][(beta-1)*X(i)*EXP(alpha*X(i))/
(EXP(ALHA*X(i)) - 1) + SUM[i=1 to n][X(i)] -
2*SUM[i=1 to n][beta*(EXP(alpha*X(I) - 1)**(beta - 1)*
X(I)*EXP(alpha*X(i))/{1 + (EXP(alpha*X(i)) - 1)**beta} = 0](eqns/lexml2.gif)