|
|
LP LOCATIONName:
The univariate measurement model (or location model) is
where \( \alpha \) is the unknown value to be estimated and the yi are the sample observations affected by the measurement errors ei. The least power (Lp) provides a broad class of location estimators. This class includes the mean, the median, and the mid-range as special cases. The Lp norm (for p >= 1) is defined as
For p = 1, 2, and \( \infty \), these become the following norms
\( ||x||_2 = \sqrt{\sum_{i=1}^{n}{x_i^{2}}} \) \( ||x||_1 = \sum_{i=1}^{n}{|x_i|} \) The Lp norm estimation is based on the minimization of the Lp norm of a suitable residual vector. Specifically, the Lp estimator of \( \alpha \) is
where arg min means the argument of the minimum. That is, the value of \( \alpha \) that results in the minimum value of the expression. The Lp estimate is the solution of the equation
The special cases mentioned above correspond to
Values of p between 1 and 2 are of most interest as these have efficiency and robustness properties between the median (p = 1) and the mean (p = 2). The Pennecchi and Callegaro paper provides the following guidelines for choosing a suitable value for p. Compute the sample kurtosis, \( \hat{k} \), of the sample observations (note that the standard kurtosis formula should be used, not the version that subtracts 3 to make the kurtosis of a normal distribution equal to 0). Then
Pennecchi and Callegaro propose the following as an estimate of the asymptotic variance
where
<SUBSET/EXCEPT/FOR qualification> where <y> is the response variable; <par> is a parameter where the computed lp location value is saved; and where the <SUBSET/EXCEPT/FOR qualification> is optional. Use this syntax to compute the Lp location estimate.
<SUBSET/EXCEPT/FOR qualification> where <y> is the response variable; <par> is a parameter where the computed variance of the lp location value is saved; and where the <SUBSET/EXCEPT/FOR qualification> is optional. Use this syntax to compute the variance of the Lp location estimate.
<SUBSET/EXCEPT/FOR qualification> where <y> is the response variable; <par> is a parameter where the computed sd of the lp location value is saved; and where the <SUBSET/EXCEPT/FOR qualification> is optional. Use this syntax to compute the standard deviation of the Lp location estimate.
LET ALOC = LP LOCATION Y LET AVAR = LP VARIANCE Y LET ASD = LP SD Y LET ALOC = LP LOCATION Y SUBSET Y > 0
SD LP LOCATION is a synonym for SD OF LP LOCATION VARIANCE LP LOCATION is a synonym for VARIANCE OF LP LOCATION
LET Y1 = NORMAL RANDOM NUMBERS FOR I = 1 1 50
LET Y2 = LAPLACE RANDOM NUMBERS FOR I = 1 1 50
LET Y3 = UNIFORM RANDOM NUMBERS FOR I = 1 1 50
LET Y4 = SLASH RANDOM NUMBERS FOR I = 1 1 50
LET Y X = STACKED Y1 Y2 Y3 Y4
.
MULTIPLOT SCALE FACTOR 2
MULTIPLOT CORNER COORDINATES 5 5 95 95
LABEL CASE ASIS
TIC MARK LABEL CASE ASIS
TITLE CASE ASIS
TITLE OFFSET 2
Y1LABEL DISPLACEMENT 15
XLIMITS 1 4
MAJOR XTIC MARK NUMBER 4
MINOR XTIC MARK NUMBER 0
X1TIC MARK LABEL FORMAT ALPHA
X1TIC MARK LABEL CONTENT Normal Laplace Uniform Slash
TIC MARK OFFSET UNITS DATA
X1TIC MARK OFFSET 0.5 0.5
CHARACTER X BLANK
LINE BLANK SOLID
.
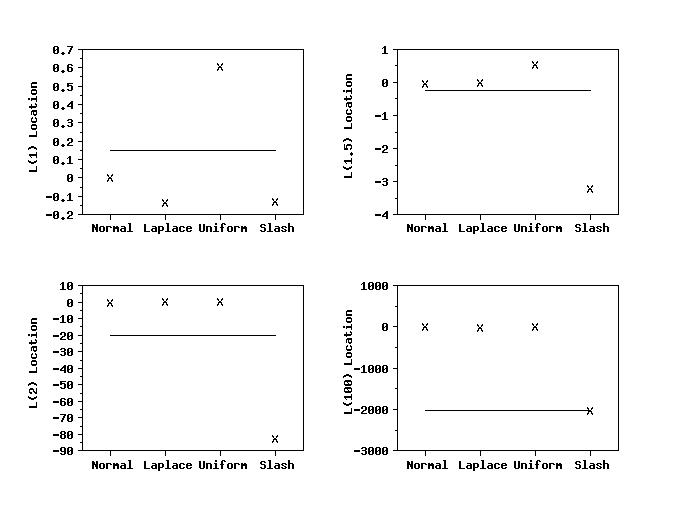
MULTIPLOT 2 2
LET P = 1
Y1LABEL L(1) Location
LP LOCATION PLOT Y X
LET P = 1.5
Y1LABEL L(1.5) Location
LP LOCATION PLOT Y X
LET P = 2
Y1LABEL L(2) Location
LP LOCATION PLOT Y X
LET P = 100
Y1LABEL L(100) Location
LP LOCATION PLOT Y X
END OF MULTIPLOT
.
SET WRITE DECIMALS 4
SET LET CROSS TABULATE COLLAPSE
LET P = 1.5
LET XGROUP = CROSS TABULATE GROUP ONE X
LET YMEAN = CROSS TABULATE LP LOCATION Y X
LET YSD = CROSS TABULATE SD OF LP LOCATION Y X
PRINT XGROUP YMEAN YSD
The following output is generated
|
Privacy
Policy/Security Notice
NIST is an agency of the U.S.
Commerce Department.
Date created: 07/14/2011 | |||||||||||||||||||||||||||||||||||||||