
|
|
SPEARMAN DISSIMILARITYName:
SPEARMAN SIMILARITY (LET)
The rank correlation is recommended in the following cases:
A perfect linear relationship yields a correlation coefficient of +1 (or -1 for a negative relationship) and no linear relationship yields a correlation coefficient of 0. In some applications, such as clustering, it can be useful to transform the correlation coefficient to a dissimilarity measure. The transformation used here is
This converts the correlation coefficient with values between -1 and 1 to a score between 0 and 1. High positive correlation (i.e., very similar) results in a dissimilarity near 0 and high negative correlation (i.e., very dissimilar) results in a dissimilarity near 1. If a similarity score is preferred, you can use
where d is defined as above.
<SUBSET/EXCEPT/FOR qualification> where <y1> is the first response variable; <y2> is the second response variable; <par> is a parameter where the computed Spearman dissimilarity is stored; and where the <SUBSET/EXCEPT/FOR qualification> is optional.
<SUBSET/EXCEPT/FOR qualification> where <y1> is the first response variable; <y2> is the second response variable; <par> is a parameter where the computed Spearman similarity is stored; and where the <SUBSET/EXCEPT/FOR qualification> is optional.
LET A = SPEARMAN DISSIMILARITY Y1 Y2 SUBSET TAG > 2 LET A = SPEARMAN SIMILARITY Y1 Y2
2018/10: SPEARMAN DISTANCE is a synonym for SPEARMAN DISSIMILARITY
SKIP 25
READ BERGER1.DAT Y X
LET CORR = RANK CORRELATION Y X
LET D    = SPEARMAN DISSIMILARITY Y X
SET WRITE DECIMALS 4
PRINT CORR D
The following output is generated
 PARAMETERS AND CONSTANTS--

    CORR    --         0.9486
    D       --         0.0257
Program 2:
SKIP 25
READ IRIS.DAT Y1 Y2 Y3 Y4
SET WRITE DECIMALS 3
.
LET M = GENERATE MATRIX SPEARMAN DISSIMILARITY Y1 Y2 Y3 Y4
PRINT M
The following output is generated
        MATRIX M       --            4 ROWS
                       --            4 COLUMNS

 VARIABLES--M1             M2             M3             M4

          0.000          0.583          0.059          0.131
          0.583          0.000          0.655          0.506
          0.059          0.655         -0.000          0.084
          0.131          0.506          0.084         -0.000
Program 3:
SKIP 25
READ IRIS.DAT Y1 Y2 Y3 Y4 TAG
.
TITLE CASE ASIS
TITLE OFFSET 2
CASE ASIS
TIC MARK OFFSET UNITS DATA
YLIMITS 0 1
MAJOR YTIC MARK NUMBER 6
MINOR YTIC MARK NUMBER 1
Y1TIC MARK LABEL DECIMAL 1
XLIMITS 1 3
MAJOR XTIC MARK NUMBER 3
MINOR XTIC MARK NUMBER 0
XTIC MARK OFFSET 0.3 0.3
CHARACTER X BLANK
LINES BLANK SOLID
.
MULTIPLOT CORNER COORDINATES 5 5 95 95
MULTIPLOT SCALE FACTOR 2
MULTIPLOT 2 3
.
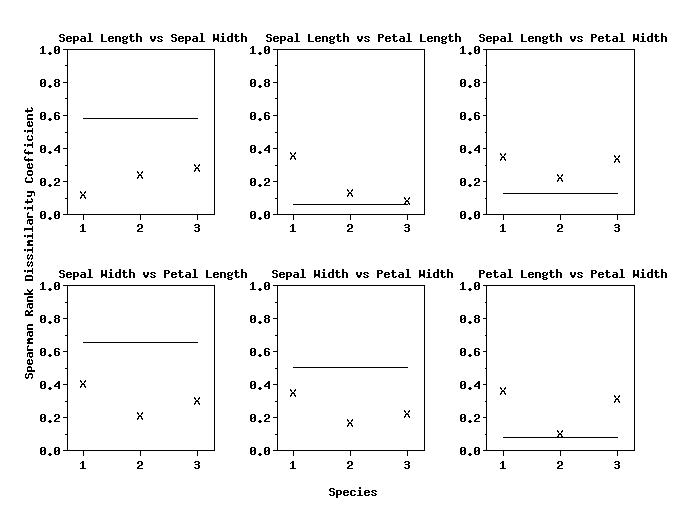
TITLE Sepal Length vs Sepal Width
SPEARMAN DISSIMILARITY PLOT Y1 Y2 TAG
.
TITLE Sepal Length vs Petal Length
SPEARMAN DISSIMILARITY PLOT Y1 Y3 TAG
.
TITLE Sepal Length vs Petal Width
SPEARMAN DISSIMILARITY PLOT Y1 Y4 TAG
.
TITLE Sepal Width vs Petal Length
SPEARMAN DISSIMILARITY PLOT Y2 Y3 TAG
.
TITLE Sepal Width vs Petal Width
SPEARMAN DISSIMILARITY PLOT Y2 Y4 TAG
.
TITLE Petal Length vs Petal Width
SPEARMAN DISSIMILARITY PLOT Y3 Y4 TAG
.
END OF MULTIPLOT
.
JUSTIFICATION CENTER
MOVE 50 5
TEXT Species
DIRECTION VERTICAL
MOVE 5 50
TEXT Spearman Rank Dissimilarity Coefficient
DIRECTION HORIZONTAL
|
Privacy
Policy/Security Notice
NIST is an agency of the U.S.
Commerce Department.
Date created: 09/20/2017 | |||||||||||||||||||||||||||||||