SED navigation bar go to SED home page go to Dataplot home page go to NIST home page SED Home Page SED Staff SED Projects SED Products and Publications Search SED Pages
Dataplot Vol 2 Vol 1

VECTOR PERCENTILE

Name:
    VECTOR PERCENTILE (LET)
Type:
    Let Subcommand
Purpose:
    Generate a vector of percentiles from a response variable.
Description:
    For response variables with a large number of rows, many desired graphs and statistical tests may become impractical. One approach to dealing with this is to replace the response variable with a specified number of percentiles of the data. For example, we might replace 1,000,000 or more rows of data with 1,000 or 10,000 percentiles. This approach can make certain analysis more practical without removing too much information. One limitation of this approach is that we are throwing away the order of the data. So for graphs and tests were order is important, this approach is not valid. However, for many graphs and tests, this can make dealing with large data sets more managable.

    The p-th percentile of a data set is defined as that value where p percent of the data is below that value and (1-p) percent of the data is above that value. For example, the 50th percentile is the median.

    The default method for computing percentiles in Dataplot is based on the order statistic. The formula is:

      \( \hat{X}_p = (1 - r)X_{NI1} + rX_{NI2} \)

    where

    • X are the observations sorted in ascending order
    • NI1 = INT(p*(n+1))
    • NI2 = NI1 + 1
    • r = p*(n+1) - INT(p*(n+1))

    If p is < 1/(n+1), then X1 is returned. If p > n/(n+1), then XN is returned.

    The above is for a single percentile. For the VECTOR PERCENTILE command, you specify the number of percentiles that you would like to compute. Dataplot will then generate the appropriate values for p in the above formulas.

Syntax 1:
    LET <y> = VECTOR PERCENTILE <x> <nperc>
                            <SUBSET/EXCEPT/FOR qualification>
    where <x> is the response variable;
                <nperc> is a number or parameter that specifies the number of percentiles to generate;
                <y> is a variable where the computed percentiles are stored;
    and where the <SUBSET/EXCEPT/FOR qualification> is optional.
Examples:
    LET Y = VECTOR PERCENTILE X 1000
    LET Y = VECTOR PERCENTILE X 10000
    LET Y = VECTOR PERCENTILE X NPERC
    LET Y = VECTOR PERCENTILE X NPERC SUBSET X > 0
Note:
    Note that there are a number of other ways of calculating percentiles in common use. Hyndman and Fan (1996) in an American Statistician article evaluated nine different methods (we will refer to these as R1 through R9) for computing percentiles relative to six desirable properties. Their goal was to advocate a "standard" definition for percentiles that would be implemented in statistical software. Although this has not in fact happened, the article does provide a useful summary and evaluation of various methods for computing percentiles. Most statistical and spreadsheet software use one of the methods described in Hyndman and Fan.

    The default method used by Dataplot described above is equivalent to method R6 of Hyndman and Fan. The description of the methods here will be in terms of the quantile q = p/100 where p is the desired percentile.

    The method advocated by Hyndman and Fan is R8. For the R8 method,

      \( X_{q} = X_{NI1} + r(X_{NI2} - X_{NI1}) \)

    where

    • X are the observations sorted in ascending order
    • NI1 = INT(q*(n+(1/3)) + (1/3))
    • NI2 = NI1 + 1
    • r = q*(n+1) - INT(q*(n+1))

    If q ≤ (2/3)/(n+(1/3)) the minimum value will be returned and if q ≥ (n-(1/3))/(n+(1/3)) the maximum value will be returned.

    Method R7 (this is the default method in R and Excel) is calculated by

      \( X_{q} = X_{NI1} + r(X_{NI2} - X_{NI1}) \)

    where

    • X are the observations sorted in ascending order
    • NI1 = INT(q*(in-1) + 1)
    • NI2 = NI1 + 1
    • r = q*(n+1) - INT(q*(n+1))

    If q = 1, then Xn is returned.

    The R6, R7, and R8 methods give fairly similar, but not exactly the same (particularly for small samples), results. For most purposes, any of these three methods should be acceptable.

Note:
    The following command is used to determine which method is used to compute the quantile:

      SET QUANTILE METHOD <ORDER/R6/R7/R8>

    R6 is equivalent to ORDER. ORDER is the default.

Default:
    The ORDER STATISTIC (R6) method is the default method for calculating percentiles.
Synonyms:
    None
Related Commands: Reference:
    Hyndman and Fan (November 1996), "Sample Quantiles in Statistical Packages", The American Statistician, Vol. 50, No. 4, pp. 361-365.
Applications:
    Data Analysis
Implementation Date:
    2016/06
Program:
    . Step 1:   Generate the raw data
    .
    let y = normal rand numb for i = 1 1 1000000
    .
    . Step 2:   Compute the desired percentiles
    .
    let nperc = 1000
    let yperc = vector percentiles y nperc
    .
    . Step 3:   Plot the percentiles
    .
    character circle
    character hw 1 0.75
    character fill on
    line blank
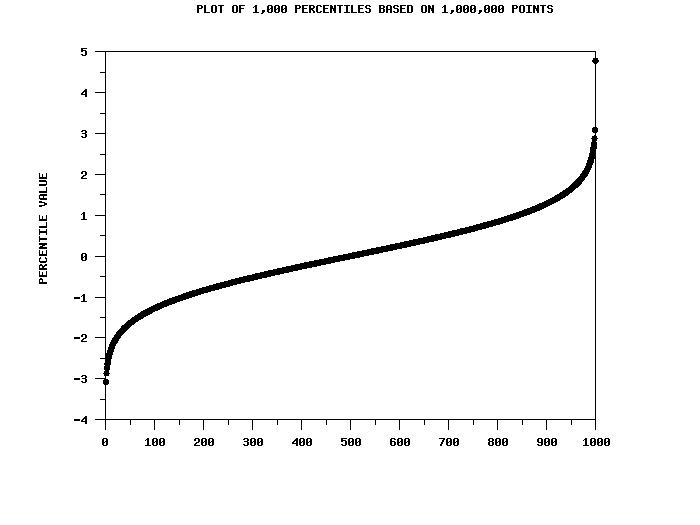
    title Plot of 1,000 Percentiles Based on 1,000,000 Points
    y1label Percentile Value
    .
    plot yperc
        
    plot generated by sample program

Privacy Policy/Security Notice
Disclaimer | FOIA

NIST is an agency of the U.S. Commerce Department.

Date created: 07/06/2016
Last updated: 07/06/2016

Please email comments on this WWW page to alan.heckert@nist.gov.