1.3. EDA Techniques
1.3.3. Graphical Techniques: Alphabetic
1.3.3.15. Lag Plot
1.3.3.15.2. |
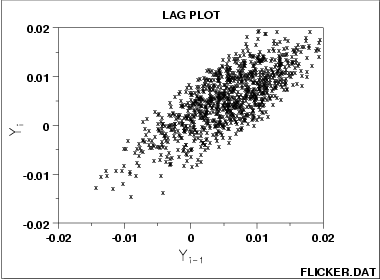
Lag Plot: Moderate Autocorrelation |

- The data are from an underlying autoregressive model with moderate positive autocorrelation
- The data contain no outliers.
If the process were completely random, knowledge of a current observation (say Yi-1 = 0) would yield virtually no knowledge about the next observation Yi. If the process has moderate autocorrelation, as above, and if Yi-1 = 0, then the range of possible values for Yi is seen to be restricted to a smaller range (.01 to +.01). This suggests prediction is possible using an autoregressive model.
-
\[ Y_{i} = A_0 + A_1*Y_{i-1} + E_{i} \]
The residual standard deviation for the autoregressive model will be much smaller than the residual standard deviation for the default model
-
\[ Y_{i} = A_0 + E_{i} \]

