
6.4. Introduction to Time Series Analysis
6.4.4. Univariate Time Series Models
6.4.4.3. Seasonality
6.4.4.3.1. |
Seasonal Subseries Plot |
This plot is only useful if the period of the seasonality is already known. In many cases, this will in fact be known. For example, monthly data typically has a period of 12.
If the period is not known, an autocorrelation plot or spectral plot can be used to determine it.
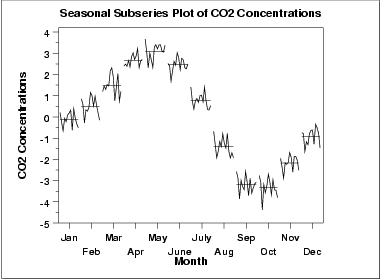
This seasonal subseries plot containing monthly data of CO2 concentrations reveals a strong seasonality pattern. The CO2 concentrations peak in May, steadily decrease through September, and then begin rising again until the May peak.
This plot allows you to detect both between group and within group patterns.
If there is a large number of observations, then a box plot may be preferable.
| Vertical axis: | Response variable |
| Horizontal axis: | Time ordered by season. For example, with monthly data, all the January values are plotted (in chronological order), then all the February values, and so on. |
The user must specify the length of the seasonal pattern before generating this plot. In most cases, the analyst will know this from the context of the problem and data collection. Sometimes the series will need to be detrended before generating the plot, as was the case for the CO2 data.
- Do the data exhibit a seasonal pattern?
- What is the nature of the seasonality?
- Is there a within-group pattern (e.g., do January and July exhibit similar patterns)?
- Are there any outliers once seasonality has been accounted for?
Run Sequence Plot
Autocorrelation Plot
