|
- Question:
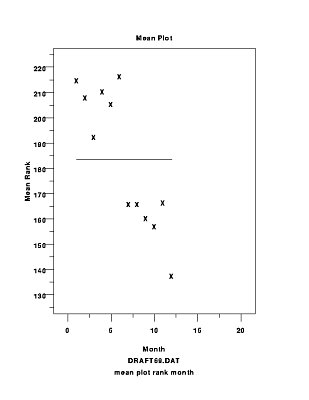
- Location shift?
- Outliers?
- Definition:
- Vertical Axis: Mean
- Horizontal Axis: Factor
- Interpretation/Conclusion:
- There is a shift in location
- There is a trend down
- NIST/SEMATECH Handbook Chapter:
- 1.
Exploratory Data Analysis
- Reference:
- Filliben ...
|
Dataplot Command: MEAN PLOT Y X
- Dataplot Code:
- SKIP 25
- READ XXX.DAT Y X
- MEAN PLOT Y X
- Dataplot Reference
Manual Documentation for MEAN PLOT
|
Date created: 06/05/2001
Last updated: 02/13/2023
Please email comments on this WWW page to
[email protected].
|
