
|
|
DRAW SYMBOLName:
The basic syntax for this command is
where XPOS and YPOS are variables that denote the x and y coordinates and TAG is a variable that denotes an index value (from 1 to 100) for the CHARACTER command and the associcated attribute setting commands for CHARACTER (e.g., CHARACTER JUSTIFICATION, CHARACTER SIZE). For example,
LET YPOS = DATA 40 55 LET TAG = DATA 1 2 CHARACTER - + CHARACTER COLOR RED BLUE DRAW SYMBOL XPOS YPOS TAG will draw a "-" symbol in red at position (35,55) and a "+" symbol at position (40,55) in blue. If one of the arguments is a parameter rather than a variable, the parameter value will be used for all rows. You can specify screen or data coordinates in the standard way (e.g., DRAWDATA SYMBOL, DRAWSD SYMBOL). These commands were motivated to provide performance improvements to the 10-step macros for 2-level full and fractional factorial designs. However, they may have use outside of that context. Specifically, if you have a number of symbols to add to a plot, using the DRAW SYMBOL command may be significantly faster than a series of MOVE and TEXT commands.
where <xpos> is a number, parameter or variable that specifies the x coordinates; <ypos> is a number, parameter or variable that specifies the y coordinates; <tag> is a number, parameter or variable that specifies an index for the CHARACTER and its associated attribute setting commands; and xx specifies a mix of screen and data units. These agruments can be a mix of parameters and variables. However, all arguments specified as variables must be the same length. If an argument is specified as a parameter or a number, that value will be used for all rows. The "xx" string is optional and consists of two characters where each character is either "S" to deonote screen units or "D" to denote data units. The first character specifies the units for the x coordinates and the second character specifies the units for the y coordinates. The "xx" can also be set to DATA in which case both the x and y coordinates specify data units. For screen units, all values should be in the 0 to 100 range. Data units are in the units of the most recent plot. The <tag> variable should contain integer values in the range 1 to 100.
DRAWSD SYMBOL XPOS YPOS TAG DRAWDATA SYMBOL XPOS YPOS TAG
Often when using the DRAW SYMBOL command, we need to set a specific CHARACTER or CHARACTER attribute setting without setting the entire list. For example, we may want to set the attributes for character trace 20 without setting or changing the attributes for traces 1 to 19. The LET PLOT command provides a convenient way to do this.
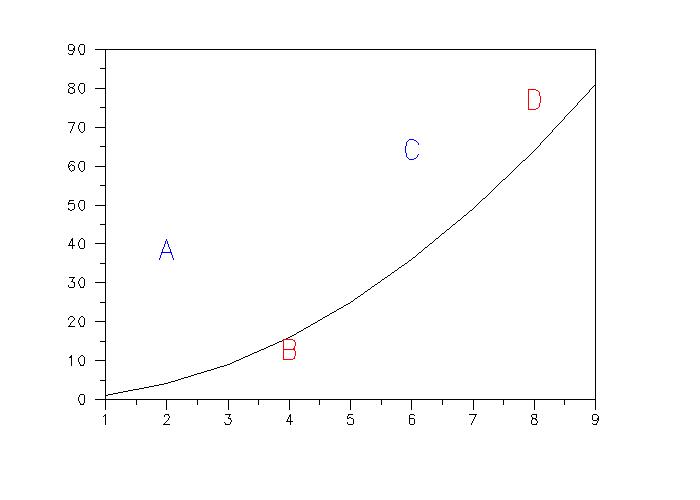
. Step 1:   Generate an initial plot
.
plot x**2 for x = 1 1 9
.
. Step 2:   Now use draw symbol command
.
let x1  = data 2 4 6 8
let y1  = data 50 30 70 80
let tag = data 1 2 3 4
.
character blank all
let plot character 1 = A
let plot character 2 = B
let plot character 3 = C
let plot character 4 = D
character color blue red blue red
character font simplex all
character size 4 all
.
drawds symbol x1 y1 tag
|
Privacy
Policy/Security Notice
NIST is an agency of the U.S.
Commerce Department.
Date created: 04/19/2018 | |||||||||||||||||||||||||||||||||||||||||||||||||||||||