KOLMOGOROV SMIRNOV GOODNESS OF FIT TEST
Name:
Type:
Purpose:
Perform a Kolmogorov-Smirnov goodness of fit test that a set of
data come from a hypothesized continuouis distributuion. Dataplot
currently supports the Kolmogorov-Smirnov goodness of fit test
for 60+ distributions.
Description:
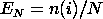
The Kolmogorov-Smirnov (K-S) test is based on the empirical
distribution function (ECDF). Given N data points
Y1 Y2 ..., Yn the ECDF is
defined as
where n(i) is the number of points less than Yi This is a
step function that increases by 1/N at the value of each data point.
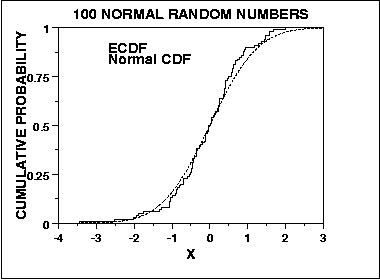
We can graph a plot of the empirical distribution function with
a cumulative distribution function for a given distribution. The
K-S test is based on the maximum distance between these two curves.
An example of this plot for a sample of 100 normal random numbers
is given here.
An attractive feature of this test is that
the distribution of the K-S test statistic itself does not
depend on the underlying cumulative distribution function being
tested. Another advantage is that it is an exact test (the
chi-square goodness of fit depends on an adequate sample size
for the approximations to be valid). Despite these advantages,
the K-S test has several important limitations:
- It only applies to continuous distributions.
- It tends to be more sensitive near the center of the
distribution than it is at the tails.
- Perhaps the most serious limitation is that the
distribution must be fully specified. That is, if
location, scale, and shape parameters are estimated
from the data, the critical region of the K-S test
is no longer valid. It typically must be determined by
simulation.
- The K-S test is only valid for continuous distributions.
Due to limitations 2 and 3 above, many analysts prefer to
use the Anderson-Darling goodness of fit test. However, the
Anderson-Darling test is only available for a few specific
distributions. In addition, the Anderson-Darling test is
more powerful than the K-S test since it makes specific use
of the underlying cumulative distribution.
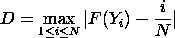
More formally, the Kolmogorov-Smirnov goodness of fit
test statistic can be defined as follows.
|
H0:
|
The data follow the specified distribution.
|
|
Ha:
|
The data do not follow the specified distribution.
|
|
Test
Statistic:
|
The Kolmogorov-Smirnov goodness of fit test statistic is
defined as
where F is the theoretical cumulative
distribution of the distribution being tested.
|
|
Significance Level:
|

|
|
Critical Region:
|
The hypothesis regarding the distributional form is
rejected if the test statistic, D, is greater than
the critical value obtained from a table. There
are several variations of these tables in the
literature that use somewhat different scalings
for the K-S test statistic and critical regions.
These alternative formulations should be equivalent,
but it is necessary to ensure that the test statistic
is calculated in a way that is consistent with how
the critical values were tabulated.
Dataplot uses the critical values from
Chakravart, Laha, and Roy (see Reference: below).
|
In order to apply the K-S goodness of fit test, any shape
parameters must be specified. For example,
LET GAMMA = 5.3
WEIBULL KOLMOGOROV-SMIRNOV GOODNESS OF FIT TEST Y
The name of the distributional parameter for families is given in
the list below.
Location and scale parameters can be specified generically with
the following commands:
LET KSLOC = <value>
LET KSSCALE = <value>
The location and scale parameters default to 0 and 1 if not
specified.
Syntax:
<dist> KOLMOGOROV SMIRNOV GOODNESS OF FIT TEST <y>
<SUBSET/EXCEPT/FOR/qualification>
where <y> is a response variable;
<dist> is one of the following distributions:
- UNIFORM
- SEMI-CIRCULAR
- TRIANGULAR
- NORMAL
- LOGISTIC
- DOUBLE EXPONENTIAL
- CAUCHY
- TUKEY LAMBDA (LAMBDA)
- LOGNORMAL (SD, optional, defaults to 1)
- HALFNORMAL
- T (NU)
- CHI-SQUARED (NU)
- F (NU1, NU2)
- EXPONENTIAL
- GAMMA (GAMMA)
- BETA (ALPHA, BETA)
- WEIBULL (GAMMA)
- EXTREME VALUE TYPE 1
- EXTREME VALUE TYPE 2 (GAMMA)
- PARETO (GAMMA)
- WALD (GAMMA)
- INVERSE GAUSSIAN (GAMMA)
- RIG (GAMMA)
- FL (GAMMA)
- NONCENTRAL BETA (ALPHA, BETA, LAMBDA)
- NONCENTRAL CHISQUARE (NU, LAMBDA)
- NONCENTRAL F (NU1, NU2, LAMBDA)
- DOUBLY NONCENTRAL F (NU1, NU2, LAMBDA1, LAMBDA2)
- NONCENTRAL T (NU, LAMBDA)
- DOUBLY NONCENTRAL T (NU, LAMBDA1, LAMBDA2)
- HYPERGEOMETRIC (K, N, M)
- VON-MISES (B)
- POWER-NORMAL (P, SD)
- POWER-LOGNORMAL (P, SD)
- COSINE
- ALPHA (ALPHA, BETA)
- POWER FUNCTION (C)
- CHI (NU)
- LOG LOGISTIC (DELTA)
- GENERALIZED GAMMA (GAMMA, C)
- ANGLIT
- ARCSIN
- HYPERBOLIC SECANT
- HALF CAUCHY
- FOLDED NORMAL (M, SD)
- TRUNCATED NORMAL (A, B, M, SD)
- TRUNCATED EXPONENTIAL (X0, M, SD)
- DOUBLE WEIBULL (GAMMA)
- LOG GAMMA (GAMMA)
- GENERALIZED EXTREME VALUE (GAMMA)
- PARETO SECOND KIND (GAMMA)
- HALF LOGISTIC (GAMMA, optional)
- EXPONENTIATED WEIBULL (GAMMA, THETA)
- GOMPERTZ (C,B)
- WRAPPED CAUCHY (C)
- BRADFORD (ALPHA, BETA)
- DOUBLE GAMMA (GAMMA)
- FOLDED CAUCHY (M, SD)
- GENERALIZED EXPONENTIAL (LAMBDA1, LAMBDA2, S)
- GENERALIZED LOGISTIC (ALPHA)
- MIELKE BETA-KAPPA (BETA, THETA, K)
- EXPONENTIAL POWER (ALPHA, BETA)
and where the <SUBSET/EXCEPT/FOR qualification> is optional.
Examples:
NORMAL KOLMOGOROV-SMIRNOV GOODNESS OF FIT TEST Y
NORMAL KOLMOGOROV-SMIRNOV GOODNESS OF FIT TEST Y SUBSET GROUP > 1
CAUCHY KOLMOGOROV-SMIRNOV GOODNESS OF FIT TEST Y
LOGNORMAL KOLMOGOROV-SMIRNOV GOODNESS OF FIT TEST X
EXTREME VALUE TYPE 1 KOLMOGOROV-SMIRNOV GOODNESS OF FIT TEST X
LET LAMBDA = 0.2
TUKEY LAMBDA KOLMOGOROV-SMIRNOV GOODNESS OF FIT TEST X
SET MINMAX = 1
LET GAMMA = 2.0
WEIBULL KOLMOGOROV-SMIRNOV GOODNESS OF FIT TEST X
LET LAMBDA = 3
POISSON KOLMOGOROV-SMIRNOV GOODNESS OF FIT TEST X
NORMAL KOLMOGOROV-SMIRNOV GOODNESS OF FIT TEST Y X
NORMAL KOLMOGOROV-SMIRNOV GOODNESS OF FIT TEST Y X1 X2
Note:
There are several approaches for estimating the parameters of a
distribution before applying the goodness of fit test. PPCC plots
combined with probability plots are an effective graphical approach
if there are zero or one shape parameters. Maximum likelihood
estimation is available for several distributions. Least squares
estimation can be applied for distributions for which maximum
likelihood estimation is not available.
Note:
The KOLMOGOROV-SMIRNOV GOODNESS OF FIT command automatically saves
the following parameters.
STATVAL - value of the K-S goodness of fit statistic
CUTUPP90 - 90% critical value (alpha = 0.10) for the K-S
goodness of fit test statistic
CUTUPP95 - 95% critical value (alpha = 0.05) for the K-S
goodness of fit test statistic
CUTUPP99 - 99% critical value (alpha = 0.01) for the K-S
goodness of fit test statistic
These parameters can be used in subsequent analysis.
Default:
Location and scale parameters default to zero and one. Shape
parameters must be explicitly specified. There is no default
distribution.
Synonyms:
EV2 and FRECHET are synonyms for EXTREME VALUE TYPE 2.
EV1 and GUMBEL are synonyms for EXTREME VALUE TYPE 1.
FATIGUE LIFE is a synonym for FL.
RECIPROCAL INVERSE GAUSSIAN is a synonym for RIG.
IG is a synonym for INVERSE GAUSSIAN.
Related Commands:
|
ANDERSON-DARLING TEST
|
= Perform Anderson-Darling test for goodness of fit.
|
|
CHI-SQUARE TEST
|
= Perform chi-square test for goodness of fit.
|
|
WILK-SHAPIRO TEST
|
= Perform Wilk-Shapiro test for normality.
|
|
MAXIMUM LIKELIHOOD
|
= Perform maximum likelihood estimation for several
distributions.
|
|
FIT
|
= Perform least squares fitting.
|
|
PROBABILITY PLOT
|
= Generates a probability plot.
|
|
HISTOGRAM
|
= Generates a histogram.
|
|
PPCC PLOT
|
= Generates probability plot correlation coefficient plot.
|
Reference:
"Handbook of Methods of Applied Statistics, Volume I",
Chakravart, Laha, and Roy, John Wiley, 1967, pp. 392-394.
Applications:
Implementation Date:
Program:
      ********************************************************
      **  normal kolmogorov-smirnov goodness of fit test y  **
      ********************************************************


                  KOLMOGOROV-SMIRNOV GOODNESS OF FIT TEST

NULL HYPOTHESIS H0:      DISTRIBUTION FITS THE DATA
ALTERNATE HYPOTHESIS HA: DISTRIBUTION DOES NOT FIT THE DATA
DISTRIBUTION:            NORMAL
   NUMBER OF OBSERVATIONS      =      195

TEST:
KOLMOGOROV-SMIRNOV TEST STATISTIC     =   0.3249392E-01

   ALPHA LEVEL         CUTOFF              CONCLUSION
           10%        0.08737               ACCEPT H0
            5%        0.09739               ACCEPT H0
            1%        0.11673               ACCEPT H0
Date created: 06/05/2001
Last updated: 12/11/2023
Please email comments on this WWW page to
alan.heckert@nist.gov.
|
|