|
|
LIMITS OF DETECTIONName:
The mathematical basis for this method is given in
Although this method was developed in the context of explosive trace detectors, its use is not limited to this application. We do not give the detailed mathematical formulation here (see the Rukhin and Samarov paper). The following is a brief discussion of this standard. ASTM subcommittee E54.01 has developed a Standard Test Method for the determination of Limit of Detection (LOD) in trace explosive detectors. The Method was developed following ISO-IUPAC guidelines that harmonize concepts of detection limits and considers the observed behaviors of response signals in a wide range of trace detectors. Here, the LOD90 is defined as the lowest amount of a particular substance for which there is 90% confidence that a single measurement will have a true detection probability of at least 90% while the true non-detection probability of a realistic process blank is at least 90%. The LOD90 value is therefore a directly useful metric of trace detector performance and reliability, since the value reflects the practical detection capability of the detector system, influenced by the inherent sensitivity, selectivity, and response variability of the system under realistic deployment conditions. The standard specifies the LOD90 value which is based on a false positive probability of 10%. You can specify an arbitrary false positive probability level by entering the command
The most typical values for ALPHA are 0.10 (LOD90), 0.05 (LOD95), or 0.01 (LOD99) with the default being 0.10. Ideally, the data for the limits of detection should include a large number of process blank replicates as well as detector responses from a large number of replicates from two mass levels closely straddling the actual LOD90 mass level. By this strategy, the Method is insensitive to many pitfalls that are encountered in commercial trace detectors, including detector response saturation, truncated response distributions, and response heteroscedasticity, i.e. changes in response variation with signal level. Practicalities dictate, however, that a limited number of replicates be analyzed and that mass levels be selected that are wide enough apart to guarantee the straddling of the unknown LOD90 value. By setting the minimum number of required replicates to ten, and by utilizing a short sequence of mass levels that increase by a factor of three, data for the calculation of an adequate LOD90 estimate may be obtained. This limits of detection method has been tested and validated with real and simulated data possessing several types of error structure. The data for the limits of detection command must be replicated mass-response pairs with the following requirements:
Dimensional units for mass levels and responses, while not identified, must be consistent. The limit of detection is reported in the same dimensional units as the mass inputs. Before calculating the limit of detection, the following data quality checks are performed (the limits of detection will not be calculated if these conditions are not satisfied):
If data quality passes, estimates will be returned for the limit of detection and the 90% upper confidence LOD90 limit (a measure of uncertainty). Results may also be returned with a message that data quality was marginal, and offer a suggestion for improving the quality. The LOD90 value determined is the best estimate of the minimum mass of a particular analyte required to elicit a real and reliable response in the detector tested. This minimum detector response is the Critical Value (CV, an optional printed output), which should relate to the peak detection threshold value that can usually be set manually in the trace detector. The peak detection threshold value is usually set higher than the CV unless the LOD90 is determined using realistic chemical background. Caveat: The LOD90 determination assumes normality for the non-zero measurements. If your data is not normal or contains significant outliers, the LOD90 value will still be calculated. However, non-normality or outliers can result in larges biases for the LOD90 estimate. Measurement data is often skewed right. In this case, you may want to take the log of the non-zero values before using the LIMITS OF DETECTION command (i.e., a lognormal model of the data might be more realistic than a normal model). To check for outliers and non-normality, the following analyses and graphs may be useful.
In addition to the LOD value and confidence limit, two tables are generated.
where <y> is a response variable; <x> is a variable containing the mass levels; and where the <SUBSET/EXCEPT/FOR qualification> is optional. Although it is typical for the data to be sorted by the value of the mass level, this is not required. The <y> and <x> variables must have the same length.
<SUBSET/EXCEPT/FOR qualification> where <y> is a response variable; <x> is a variable containing the mass levels; <batch> is a group-id variable; and where the <SUBSET/EXCEPT/FOR qualification> is optional. This syntax can be used when multiple analytes are being tested. Each distinct value of <batch> denotes a specific analyte for which a limit of detection will be computed. So if <batch> has three distinct values, three limit of detection computations will be performed. Although it is typical that the data be sorted by the value of the group-id variable and for the data within a specific group to be sorted by the mass level, this is not required. The <y>, <x> and <batch> variables must have the same length. The word REPLICATION is optional. If exactly three variables are specified, the REPLICATION option is assumed.
<SUBSET/EXCEPT/FOR qualification> where <y1> ... <yk> is a list of 1 to 30 response variables; <x> is a variable containing the mass levels; and where the <SUBSET/EXCEPT/FOR qualification> is optional. This syntax can be used when multiple analytes are being tested. Note that this syntax assumes each analyte has the same mass variable. If this is not the case, the REPLICATED syntax should be used. Although it is typical for the data to be sorted by the value of the mass level, this is not required. All the variables must have the same length. For this syntax, the word MULTIPLE is required.
REPLICATED LIMITS OF DETECTION Y X GROUP LIMITS OF DETECTION Y X GROUP MULTIPLE LIMITS OF DETECTION Y1 Y2 Y3 Y4 Y5 X MULTIPLE LIMITS OF DETECTION Y1 TO Y5 X ONE SAMPLE PROFICIENCY TEST Y LABID TWO SAMPLE PROFICIENCY TEST Y1 Y2 LABID
The default for all four of the above is 0.10. Values greater than 0.5 are interpreted as 1 - the value (i.e., entering .9 is equivalent to entering 0.1). Some instruments may provide a vendor supplied critical value. To specify a pre-defined critical value, enter
If no critical value is given, the critical value is estimated from the data. This value should typically only be given if supplied by the vendor for a specific instrument. The data quality checks are typically based on 90% of the values being either zero or 90% of the values being non-zero. To specify a different threshold percentage for the data quality checks, enter
where <value> is between 80 and 100. Values between 90 and 100 are most common and a value outside the (80,100) interval will be set to the default of 90. The defaults for all of the above parameters are those specified in the E-2677 standard.
SET LOD TABLE <ON/OFF> To specify whether the critical value is printed, enter
All of the above are ON by default.
The default is QUANTILE.
The default is ON. Note that if the REPLICATION or MULTIPLE option is used to generate multiple limits of detection analyses, only the last limit of detection analysis will be contained in dpst1f.dat and dpst2f.dat.
If you use the MULTIPLE or REPLICATION options, these values are written to dpst3f.dat instead. Each row of dpst3f.dat will contain the values for a specific limits of detection analysis.
The URL for this web-based calculator is
E2677 - 14 "Standard Test Method for Determining Limits of Detection in Explosive Trace Detectors," ASTM International, 100 Barr Harbor Drive, PO BOX C700, West Conshohoceken, PA 19428-2959, USA. Currie, L.A. (1999), "Detection and quantification limits: origins and historical overview," Analytica Chimica Acta 391, 103-134.
2011/01: Allow user-specified crtical value 2012/01: Options for which outputs are printed 2014/03: E2677 adopted, a few tweaks in the output to be consistent with the standard 2018/07: Modified to accomodate negative response values 2018/11: Support for REPLICATION/MULTIPLE options 2018/11: A few minor tweaks in the output format . Step 1: Read the data . dimension 40 columns skip 25 set read format f4.0,2f15.1,4f15.0 read std_lod.txt x y1 to y6 skip 0 set read format . . Step 2: Run the limits of detection command . and the Grubbs test for outliers . set write decimals 4 limits of detection y1 x print " " print " " replicated grubbs test y1 x subset y1 > 0The following output is generated
Limits of Detection Analysis
(Based on ASTM E-2677 Standard)
Response Variable: Y1
Mass Variable: X
Final Estimate:
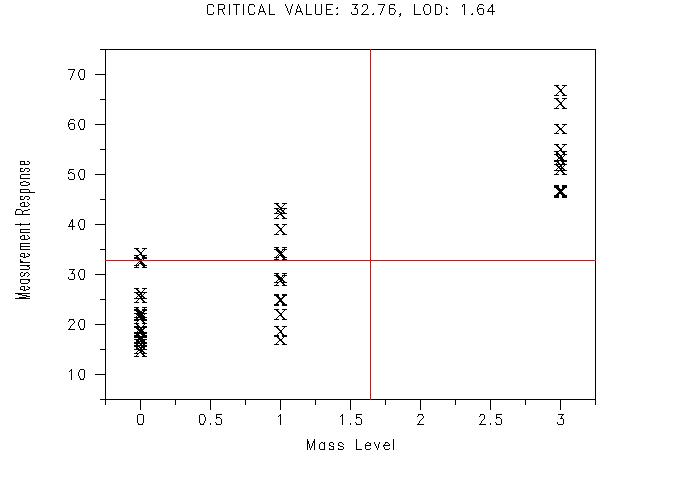
Critical Value (Cv90): 32.7600
Detection Limit (LOD90): 1.6418
90% Upper Confidence Limit on LOD: 2.4654
Summary Table
--------------------------------------------------------------------------------------
Mass Number of Number of Mean of SD of
Values Zero Values Non-Zero Values Non-Zero Values Non-Zero Values
--------------------------------------------------------------------------------------
0.0000 0 20 21.1700 6.0745
1.0000 0 12 29.8250 8.8439
3.0000 0 12 53.9083 6.5607
10.0000 0 12 119.2417 7.1701
30.0000 0 12 317.1667 13.1563
--------------------------------------------------------------------------------------
LOD Table
---------------------------------------------------------------------------------------------------------
Linear StdDev of LOD Estimate 1-Sigma 90%-90%
Least Squares Errors From Based On Uncertainty 90% Upper Upper
Mass Slope Linear Cumulated on LOD Confidence Tolerance
Values Estimates Model Sample Estimate Limit on LOD Limit on LOD
---------------------------------------------------------------------------------------------------------
0.0000 ** ** ** ** ** **
1.0000 6.3649 8.8439 2.6813 1.0942 13.9859 23.8593
3.0000 9.7710 8.0447 1.6418 0.1801 2.4654 4.0708
10.0000 9.5957 7.6683 1.6215 0.1383 2.1200 3.4476
30.0000 9.7690 9.2329 1.7980 0.1321 2.2435 3.7266
---------------------------------------------------------------------------------------------------------
***** NOTE--
SUBSET VARIABLE = Y1
SUBSET MINIMUM = 0.1000000000E-05
SUBSET MAXIMUM = 0.3402823000E+39
INPUT NUMBER OF OBSERVATIONS = 68
NUMBER OF OBSERVATIONS IGNORED = 0
OUTPUT NUMBER OF OBSERVATIONS = 68
Grubbs Test for Outliers: Test for Minimum and Maximum
(Assumption: Normality)
Response Variable: Y1
Factor Variable 1: X 1.0000
H0: There are no outliers
Ha: The extreme point is an outlier
Potential Outlier Value Tested: 34.1000
Summary Statistics:
Number of Observations: 20
Sample Minimum: 14.6000
ID for Sample Minimum: 3
Sample Maximum: 34.1000
ID for Sample Maximum: 18
Sample Mean: 21.1700
Sample SD: 6.0745
Sample Skewness: 1.0107
Sample Kurtosis: 2.8222
Grubbs Test Statistic Value: 2.1286
Percent Points of the Reference Distribution
-----------------------------------
Percent Point Value
-----------------------------------
0.0 = 0.000
50.0 = 2.121
75.0 = 2.325
90.0 = 2.557
95.0 = 2.708
97.5 = 2.843
99.0 = 3.001
100.0 = 4.249
Conclusions (Upper 1-Tailed Test)
----------------------------------------------
Alpha CDF Critical Value Conclusion
----------------------------------------------
10% 90% 2.557 Accept H0
5% 95% 2.708 Accept H0
2.5% 97.5% 2.843 Accept H0
1% 99% 3.001 Accept H0
Grubbs Test for Outliers: Test for Minimum and Maximum
(Assumption: Normality)
Response Variable: Y1
Factor Variable 1: X 2.0000
H0: There are no outliers
Ha: The extreme point is an outlier
Potential Outlier Value Tested: 43.2000
Summary Statistics:
Number of Observations: 12
Sample Minimum: 16.9000
ID for Sample Minimum: 29
Sample Maximum: 43.2000
ID for Sample Maximum: 22
Sample Mean: 29.8250
Sample SD: 8.8439
Sample Skewness: 0.1240
Sample Kurtosis: 1.8189
Grubbs Test Statistic Value: 1.5123
Percent Points of the Reference Distribution
-----------------------------------
Percent Point Value
-----------------------------------
0.0 = 0.000
50.0 = 1.886
75.0 = 2.079
90.0 = 2.285
95.0 = 2.411
97.5 = 2.518
99.0 = 2.636
100.0 = 3.175
Conclusions (Upper 1-Tailed Test)
----------------------------------------------
Alpha CDF Critical Value Conclusion
----------------------------------------------
10% 90% 2.285 Accept H0
5% 95% 2.411 Accept H0
2.5% 97.5% 2.518 Accept H0
1% 99% 2.636 Accept H0
Grubbs Test for Outliers: Test for Minimum and Maximum
(Assumption: Normality)
Response Variable: Y1
Factor Variable 1: X 3.0000
H0: There are no outliers
Ha: The extreme point is an outlier
Potential Outlier Value Tested: 66.7000
Summary Statistics:
Number of Observations: 12
Sample Minimum: 46.4000
ID for Sample Minimum: 44
Sample Maximum: 66.7000
ID for Sample Maximum: 34
Sample Mean: 53.9083
Sample SD: 6.5607
Sample Skewness: 0.7109
Sample Kurtosis: 2.5374
Grubbs Test Statistic Value: 1.9497
Percent Points of the Reference Distribution
-----------------------------------
Percent Point Value
-----------------------------------
0.0 = 0.000
50.0 = 1.886
75.0 = 2.079
90.0 = 2.285
95.0 = 2.411
97.5 = 2.518
99.0 = 2.636
100.0 = 3.175
Conclusions (Upper 1-Tailed Test)
----------------------------------------------
Alpha CDF Critical Value Conclusion
----------------------------------------------
10% 90% 2.285 Accept H0
5% 95% 2.411 Accept H0
2.5% 97.5% 2.518 Accept H0
1% 99% 2.636 Accept H0
Grubbs Test for Outliers: Test for Minimum and Maximum
(Assumption: Normality)
Response Variable: Y1
Factor Variable 1: X 4.0000
H0: There are no outliers
Ha: The extreme point is an outlier
Potential Outlier Value Tested: 106.1000
Summary Statistics:
Number of Observations: 12
Sample Minimum: 106.1000
ID for Sample Minimum: 47
Sample Maximum: 131.8000
ID for Sample Maximum: 53
Sample Mean: 119.2417
Sample SD: 7.1701
Sample Skewness: -0.0836
Sample Kurtosis: 2.4406
Grubbs Test Statistic Value: 1.8329
Percent Points of the Reference Distribution
-----------------------------------
Percent Point Value
-----------------------------------
0.0 = 0.000
50.0 = 1.886
75.0 = 2.079
90.0 = 2.285
95.0 = 2.411
97.5 = 2.518
99.0 = 2.636
100.0 = 3.175
Conclusions (Upper 1-Tailed Test)
----------------------------------------------
Alpha CDF Critical Value Conclusion
----------------------------------------------
10% 90% 2.285 Accept H0
5% 95% 2.411 Accept H0
2.5% 97.5% 2.518 Accept H0
1% 99% 2.636 Accept H0
Grubbs Test for Outliers: Test for Minimum and Maximum
(Assumption: Normality)
Response Variable: Y1
Factor Variable 1: X 5.0000
H0: There are no outliers
Ha: The extreme point is an outlier
Potential Outlier Value Tested: 337.6000
Summary Statistics:
Number of Observations: 12
Sample Minimum: 297.9000
ID for Sample Minimum: 64
Sample Maximum: 337.6000
ID for Sample Maximum: 66
Sample Mean: 317.1667
Sample SD: 13.1563
Sample Skewness: -0.1358
Sample Kurtosis: 1.8576
Grubbs Test Statistic Value: 1.5531
Percent Points of the Reference Distribution
-----------------------------------
Percent Point Value
-----------------------------------
0.0 = 0.000
50.0 = 1.886
75.0 = 2.079
90.0 = 2.285
95.0 = 2.411
97.5 = 2.518
99.0 = 2.636
100.0 = 3.175
Conclusions (Upper 1-Tailed Test)
----------------------------------------------
Alpha CDF Critical Value Conclusion
----------------------------------------------
10% 90% 2.285 Accept H0
5% 95% 2.411 Accept H0
2.5% 97.5% 2.518 Accept H0
1% 99% 2.636 Accept H0
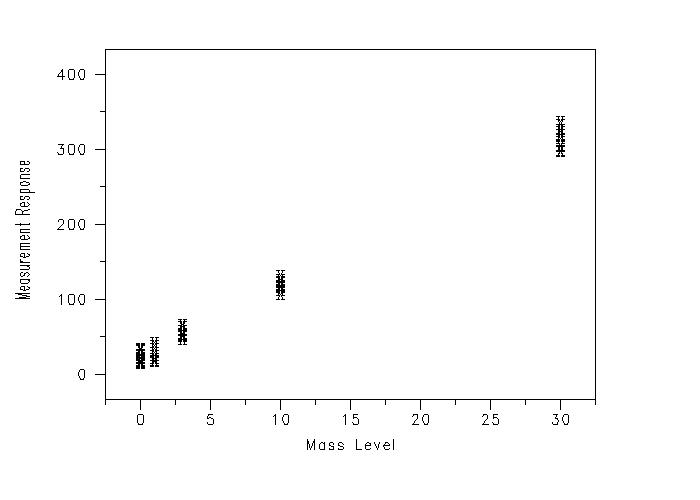
. . Step 3: Generate the scatter plot of the data . character x all line blank all label case asis y1label displacement 10 x1label Mass Level y1label Measurement Response tic offset units screen tic offset 5 5 plot y1 x label tic offset units tic offset 0 0 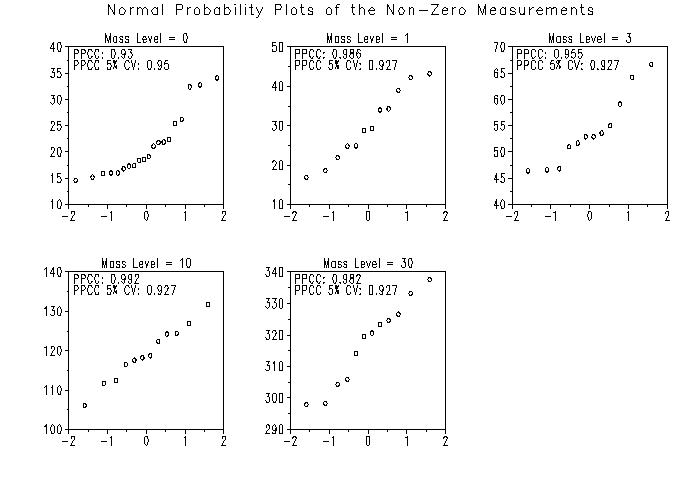 Program 2:
skip 25
set read format f4.0,2f15.1,4f15.0
read std_lod.txt x y1 to y6
skip 0
set read format
.
set write decimals 4
multiple limits of detection y1 y2 y3 y4 y5 y6 x
The following ouput is generated
Limits of Detection Analysis
(Based on ASTM E-2677 Standard)
Response Variable: Y1
Mass Variable: X
Final Estimate:
Critical Value (Cv90): 32.7600
Detection Limit (LOD90): 1.6418
90% Upper Confidence Limit on LOD: 2.4654
Summary Table
--------------------------------------------------------------------------------------
Mass Number of Number of Mean of SD of
Values Zero Values Non-Zero Values Non-Zero Values Non-Zero Values
--------------------------------------------------------------------------------------
0.0000 0 20 21.1700 6.0745
1.0000 0 12 29.8250 8.8439
3.0000 0 12 53.9083 6.5607
10.0000 0 12 119.2417 7.1701
30.0000 0 12 317.1667 13.1563
--------------------------------------------------------------------------------------
LOD Table
---------------------------------------------------------------------------------------------------------
Linear StdDev of LOD Estimate 1-Sigma 90%-90%
Least Squares Errors From Based On Uncertainty 90% Upper Upper
Mass Slope Linear Cumulated on LOD Confidence Tolerance
Values Estimates Model Sample Estimate Limit on LOD Limit on LOD
---------------------------------------------------------------------------------------------------------
0.0000 ** ** ** ** ** **
1.0000 6.3649 8.8439 2.6813 1.0942 13.9859 23.8593
3.0000 9.7710 8.0447 1.6418 0.1801 2.4654 4.0708
10.0000 9.5957 7.6683 1.6215 0.1383 2.1200 3.4476
30.0000 9.7690 9.2329 1.7980 0.1321 2.2435 3.7266
---------------------------------------------------------------------------------------------------------
Limits of Detection Analysis
(Based on ASTM E-2677 Standard)
Response Variable: Y2
Mass Variable: X
Final Estimate:
Critical Value (Cv90): 12.8300
Detection Limit (LOD90): 2.2424
90% Upper Confidence Limit on LOD: 3.5695
Summary Table
--------------------------------------------------------------------------------------
Mass Number of Number of Mean of SD of
Values Zero Values Non-Zero Values Non-Zero Values Non-Zero Values
--------------------------------------------------------------------------------------
0.0000 0 20 0.2050 7.2844
1.0000 0 12 14.2500 9.8204
3.0000 0 12 28.4833 10.3888
10.0000 0 12 86.7417 12.5594
30.0000 0 12 262.1167 11.0680
--------------------------------------------------------------------------------------
LOD Table
---------------------------------------------------------------------------------------------------------
Linear StdDev of LOD Estimate 1-Sigma 90%-90%
Least Squares Errors From Based On Uncertainty 90% Upper Upper
Mass Slope Linear Cumulated on LOD Confidence Tolerance
Values Estimates Model Sample Estimate Limit on LOD Limit on LOD
---------------------------------------------------------------------------------------------------------
0.0000 ** ** ** ** ** **
1.0000 11.4947 9.8204 1.7003 0.4406 4.4354 7.4830
3.0000 8.8679 10.0867 2.2424 0.2916 3.5695 5.9200
10.0000 8.4413 10.8222 2.4674 0.2039 3.3003 5.4811
30.0000 8.6232 10.8134 2.4140 0.1825 3.0279 5.0053
---------------------------------------------------------------------------------------------------------
Limits of Detection Analysis
(Based on ASTM E-2677 Standard)
Response Variable: Y3
Mass Variable: X
Final Estimate:
Critical Value (Cv90): 152.3000
Detection Limit (LOD90): 4.3436
90% Upper Confidence Limit on LOD: 5.9310
Summary Table
--------------------------------------------------------------------------------------
Mass Number of Number of Mean of SD of
Values Zero Values Non-Zero Values Non-Zero Values Non-Zero Values
--------------------------------------------------------------------------------------
0.0000 0 20 89.6000 35.6893
1.0000 0 12 118.3333 33.9367
3.0000 0 12 150.0000 18.6304
10.0000 0 12 272.4167 33.8216
30.0000 0 12 603.9167 35.5207
--------------------------------------------------------------------------------------
LOD Table
---------------------------------------------------------------------------------------------------------
Linear StdDev of LOD Estimate 1-Sigma 90%-90%
Least Squares Errors From Based On Uncertainty 90% Upper Upper
Mass Slope Linear Cumulated on LOD Confidence Tolerance
Values Estimates Model Sample Estimate Limit on LOD Limit on LOD
---------------------------------------------------------------------------------------------------------
0.0000 ** ** ** ** ** **
1.0000 26.1403 33.9367 3.2526 1.2697 14.0966 21.9875
3.0000 19.9561 27.1842 3.8270 0.6656 6.3183 9.2591
10.0000 18.1982 29.2709 4.3436 0.5454 5.9310 8.7120
30.0000 17.1817 31.0788 4.7354 0.5461 6.0514 8.9284
---------------------------------------------------------------------------------------------------------
Limits of Detection Analysis
(Based on ASTM E-2677 Standard)
Response Variable: Y4
Mass Variable: X
Final Estimate:
Critical Value (Cv90): 29.8000
Detection Limit (LOD90): 1.5189
90% Upper Confidence Limit on LOD: 2.1779
Summary Table
--------------------------------------------------------------------------------------
Mass Number of Number of Mean of SD of
Values Zero Values Non-Zero Values Non-Zero Values Non-Zero Values
--------------------------------------------------------------------------------------
0.0000 0 20 20.6000 6.3029
1.0000 0 12 30.1667 4.4890
3.0000 0 12 47.6667 5.7102
10.0000 0 12 62.4167 7.5131
30.0000 0 12 70.7500 4.8265
--------------------------------------------------------------------------------------
LOD Table
---------------------------------------------------------------------------------------------------------
Linear StdDev of LOD Estimate 1-Sigma 90%-90%
Least Squares Errors From Based On Uncertainty 90% Upper Upper
Mass Slope Linear Cumulated on LOD Confidence Tolerance
Values Estimates Model Sample Estimate Limit on LOD Limit on LOD
---------------------------------------------------------------------------------------------------------
0.0000 ** ** ** ** ** **
1.0000 8.1512 4.4890 1.5008 0.2975 2.9526 4.4843
3.0000 8.5105 5.0306 1.5189 0.1890 2.1779 3.2843
10.0000 4.4465 9.8315 4.2909 0.4176 6.0165 9.9587
30.0000 1.9318 16.6355 14.3901 1.3526 20.2616 35.5926
---------------------------------------------------------------------------------------------------------
Limits of Detection Analysis
(Based on ASTM E-2677 Standard)
Response Variable: Y5
Mass Variable: X
Final Estimate:
Critical Value (Cv90): 66.9000
Detection Limit (LOD90): 3.6005
90% Upper Confidence Limit on LOD: 4.8802
Summary Table
--------------------------------------------------------------------------------------
Mass Number of Number of Mean of SD of
Values Zero Values Non-Zero Values Non-Zero Values Non-Zero Values
--------------------------------------------------------------------------------------
0.0000 0 20 43.7000 16.6041
1.0000 0 12 58.0833 18.1732
3.0000 0 12 72.5833 17.2440
10.0000 0 12 154.7500 11.8254
30.0000 0 12 344.3333 3.3394
--------------------------------------------------------------------------------------
LOD Table
---------------------------------------------------------------------------------------------------------
Linear StdDev of LOD Estimate 1-Sigma 90%-90%
Least Squares Errors From Based On Uncertainty 90% Upper Upper
Mass Slope Linear Cumulated on LOD Confidence Tolerance
Values Estimates Model Sample Estimate Limit on LOD Limit on LOD
---------------------------------------------------------------------------------------------------------
0.0000 ** ** ** ** ** **
1.0000 12.0090 18.1732 3.4519 1.5454 22.9214 36.8784
3.0000 9.1536 17.4612 4.4290 0.8898 8.2311 12.8500
10.0000 10.7118 15.9206 3.6005 0.4068 4.8802 7.4342
30.0000 10.0258 14.3593 3.6472 0.4079 4.6299 6.8946
---------------------------------------------------------------------------------------------------------
Limits of Detection Analysis
(Based on ASTM E-2677 Standard)
Response Variable: Y6
Mass Variable: X
Final Estimate:
Critical Value (Cv90): 44.0000
Detection Limit (LOD90): 5.8926
90% Upper Confidence Limit on LOD: 7.4054
Summary Table
--------------------------------------------------------------------------------------
Mass Number of Number of Mean of SD of
Values Zero Values Non-Zero Values Non-Zero Values Non-Zero Values
--------------------------------------------------------------------------------------
0.0000 20 0 0.0000 0.0000
1.0000 12 0 0.0000 0.0000
3.0000 8 4 51.0000 4.9666
10.0000 0 12 111.8333 10.4693
30.0000 0 12 310.8333 10.7605
--------------------------------------------------------------------------------------
LOD Table
---------------------------------------------------------------------------------------------------------
Linear StdDev of LOD Estimate 1-Sigma 90%-90%
Least Squares Errors From Based On Uncertainty 90% Upper Upper
Mass Slope Linear Cumulated on LOD Confidence Tolerance
Values Estimates Model Sample Estimate Limit on LOD Limit on LOD
---------------------------------------------------------------------------------------------------------
0.0000 ** ** ** ** ** **
1.0000 ** ** ** ** ** **
3.0000 17.0000 4.9666 3.7488 0.1825 5.4695 6.7043
10.0000 11.3528 12.8120 5.8926 0.1892 7.4054 9.6081
30.0000 10.4629 13.3701 6.2753 0.0731 7.3204 9.4806
---------------------------------------------------------------------------------------------------------
Date created: 11/06/2018 |
Last updated: 12/11/2023 Please email comments on this WWW page to alan.heckert@nist.gov. | |||||||||||||||||||||||||||||||||||||||||||