SED navigation bar go to SED home page go to Dataplot home page go to NIST home page SED Home Page SED Staff SED Projects SED Products and Publications Search SED Pages
Dataplot Vol 1 Vol 2

R SCRIPT

Name:
    RSCRIPT
Type:
    Support Command
Purpose:
    Run an R script within a Dataplot session.
Description:
    It may on occassion be useful to run an R script within a Dataplot session. Note that Dataplot assumes that R is already installed on your local system. Also, any R packages that your script needs should already be installed. Dataplot does not initiate an install of R if it not already installed.

    If R is not installed on your default path, you can specify it using the SET R PATH command. For example, the following can be used for version 3.6.1 under Windows

      set r path "c:\program files\r\r-3.6.1\bin\"

    On Linux systems, R is typically installed in "/usr/bin" which is in the default path on most systems. So for Linux systems, the SET R PATH command is typically not required. However, if R is not in the default path, you can use the SET R PATH command.

    On Windows platforms, the RSCRIPT command is equivalent to entering

      set system persist off
      set system hidden on
      system <r-path>\rscript.exe <r-script-file> <arg-list>

    Note that if either the R path or the <r-script-file> contains spaces (and so will be quoted), then "set system hidden" will be set to "off".

    On Linux platforms, the RSCRIPT command is equivalent to entering

      system <r-path>/Rscript <r-script-file> <arg-list>

    Rscript is a binary front end to R for scripting with R.

Syntax:
    RSCRIPT <script-file> <arg-list>
    where <script-file> contains the name of a file containing an R script;
    and where <arg-list> is an optional list of arguments to the script.
Examples:
    RSCRIPT plot.R
Note:
    This command is host dependent. It has been tested on Windows and Linux systems. Note that the SYSTEM command must be activated for this command to work.
Note:
    Dataplot does no error checking on the specified script file. It is passed as is to the Rscript (or RSCRIPT.EXE) command.
Note:
    The CAPTURE SCRIPT command can be used to generate the R script within a Dataplot macro. This is demonstrated in the Program example below.
Note:
    The name of the script file is case sensitive on Linux and MacOS systems. It is not case sensitive on Windows systems.

    If Dataplot does not find the R script file, it will search for it in the "scripts" sub-directory in the Dataplot auxiliary directory. Currently (2019/12), there are no R scripts in that directory, although this may change in future releases of Dataplot.

Note:
    Dataplot does not support R as a synonym for RSCRIPT. This is due to the fact that R has long been used as a synonym for the REPEAT command.
Default:
    None
Synonyms:
    None
Related Commands:
    SYSTEM = Issue an operating system command within Dataplot.
    PYTHON = Run a Python script within Dataplot.
    CAPTURE SCRIPT = Create a script file within Dataplot.
    PSVIEW = View Postscript, PDF and image files.
    LIST = View the contents of a file.
Applications:
    Run R scripts
Implementation Date:
    2019/12
Program:
     
    . Step 1: Create the R script using "capture script"
    .
    rm rout.txt  rout.pdf  r_test.r
    .
    capture script r_test.r
    # This is R program file     r_test.r     11/4/19
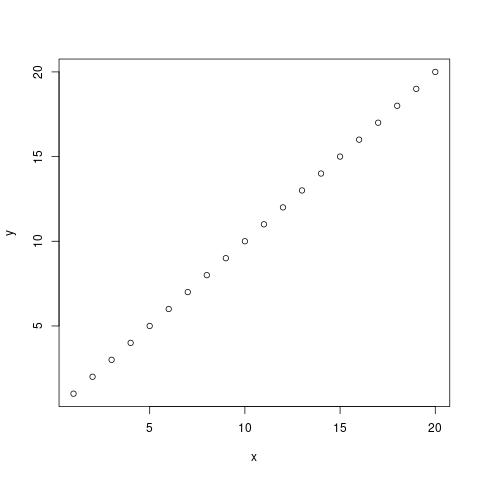
    # Purpose: Generate a sequence, square it, and plot it
    # Date: 11/4/19
    #
    # -----start point-----
    #
    x=seq(1,20,length.out=20)
    y=x^2
    both=c(x,y)
    
    sink("rout.txt")
       both
    sink()
    
    jpeg("rout.jpg")
    plot(x,y)
    dev.off()
    end of capture
    .
    list r_test.r
    .
    . Step 2:   Determine if running on Windows or Linux and set R path
    .
    let computer = 1
    probe iopsy1
    if probeval = 1
       let computer = 2
    end of if
    .
    .           May need to tweak path for R based on version and
    .           optionally set desired Postscript viewer
    .
    if computer = 1
       set r path "c:\program files\r\r-3.6.1\bin\"
    end of if
    .
    . Step 3:   Run the R script
    .
    rscript  r_test.r
    .
    . Step 4:   Display the outputs in Dataplot
    .
    list rout.txt
    .
    psview rout.jpg
        
    The following output is generated.
     
     [1]  1  2  3  4  5  6  7  8  9 10 11 12 13 14 15 16 17 18 19 20  1  2  3  4  5
    [26]  6  7  8  9 10 11 12 13 14 15 16 17 18 19 20
        

    plot generated by sample program

Privacy Policy/Security Notice
Disclaimer | FOIA

NIST is an agency of the U.S. Commerce Department.

Date created: 12/19/2019
Last updated: 01/08/2020

Please email comments on this WWW page to alan.heckert@nist.gov.