
|
|
TABULATION PLOTName:
Like the fluctuation plot, the tabulation plot is based on a statistic generated from one or more response variables. The statistic is computed for one to four group-id variables and a grid is created so that is each combination of categories has a fixed position on the grid. For the fluctuation plot, at each grid position, two rectangles are drawn. The first is drawn in a background color and is full size (i.e., the maximum value of the statistic). A second rectangle is drawn in a foreground color with a height proportional to the value of the statistic for that particular combination of categories. For the tabulation plot, only one rectangle is drawn. However, the color of the rectangle is based on the value of the statistic relative to a "levels" variable (hence the similarity to a contour plot). The Program examples below demonstrate how to create and use the level variable. With the CHARACTER TABULATION PLOT, the actual value of the statistic is printed rather than a rectangle. This is essentially a graphical table. In addition, you can specify a "background" character. This is typically set to either a filled or an unfilled box and is used to provide highlighting. This is demonstrated in one of the Program examples below. The appearance of the tabulation plot is controlled by appropriate settings for the REGION, LINE, and CHARACTER settings. This is demonstrated in the Program examples below. The list of supported statistics can be obtained by entering
If no statistic is specified, the MEAN is assumed (note that this is different than the FLUCTUATION PLOT which defaults to COUNT).
<SUBSET/EXCEPT/FOR qualification> where <stat> is one of the supported statistics; <y1> ... <y3> is a list of one to three response variables (depending on how many variables <stat> requires); <x1> ... <xk> is a list of one to four categorical variables; <ylevel> is a variable that defines the levels; and where the <SUBSET/EXCEPT/FOR qualification> is optional. If <stat> is omitted, it defaults to MEAN. If <stat> is COUNT (or SIZE or NUMBER), no response variables are given.
<SUBSET/EXCEPT/FOR qualification> where <stat> is one of the supported statistics; <y1> ... <y3> is a list of one to three response variables (depending on how many variables <stat> requires); <x1> ... <xk> is a list of one to four categorical variables; <ylevel> is a variable that defines the levels; and where the <SUBSET/EXCEPT/FOR qualification> is optional. If <stat> is omitted, it defaults to MEAN. If <stat> is COUNT (or SIZE or NUMBER), no response variables are given. This syntax generates the "character" version of the tabulation plot.
TABULATION BINOMIAL PROBABILITY PLOT Y X1 X2 TABULATION PLOT M
When there are two or more categorical variables, the division is first performed vertically, then horizontally. This vertical/horizontal subdivision is repeated until all the categorical variables are accommodated. When there are two or more categorical variables, you can change the vertical/horizontal order to horizontal/vertical by entering the command
To restore the default order, enter
When some of the combinations of levels for the factor variables are missing, it is desirable to suppress this coding. The following command was added in order to specify whether or not this coding is applied:
Setting this option to OFF will use the original units for the factor variables. Setting this option to ON (the default) will use the coded values from 1 to NDIST.
SET TABULATION SORTED OFF SET TABULATION SORTED ROW SET TABULATION SORTED COLUMN ON specifies that both the column and row direction will be sorted, OFF (the default) specifies that neither direction will be sorted, ROW specifies that the vertical direction will be sorted, and COLUMN specifies that the horizontal direction will be sorted. You can specify whether the sort is an ascending (the default) or a descending sort by entering the commands
SET TABULATION ROW SORT DIRECTION <ASCENDING/DESCENDING>
You can specify this with the following commands
SET TABULATION PLOT COLUMN MINMAX <ON/OFF> The use of these commands is demonstrated in the program examples below.
For the basic TABULATION PLOT, the number of traces is equal to the number of levels. The settings and attributes for the first trace apply to the lowest level, the second trace applies to the second lowest level, and so on. This is demonstrated in the Program 1 example. For the CHARACTER TABULATION PLOT, there are two sets of settings and attributes. The first set applies to the background character (this is "highlighting" feature). This is typically an empty or filled box or empty circle, but you can set it to whatever you like. The second set applies to the foreground character. This is demonstrated in the Program examples below. If the ROW MINMAX or COLUMN MINMAX option is used for the CHARACTER TABULATION PLOT adds two additional traces (the first for the minimum value and the second for the maximum value). For this option, the background character settings are usually left blank and the highlighting is applied to the row or column minimum/maximum values. This is demonstrated in the program examples below.
SET TABULATION PLOT Y INCREMENT <value> The default increments are set to 0.05 (in data units). Setting these values to 0 will result in rectangles with no gaps. To turn on the uncertainty intervals for these cases, enter
To turn off the uncertainty intervals for these cases, enter
To specify the number of intervals, enter
where <value> is an integer value between 0 and 100. The default is 50. Note that this option still needs algorithmic work and is not yet recommended for general usage. Note:
These programs are based on the Wright brothers flight data data set (WRIGHT11.DAT). The Program examples modify the WRIGHT6.DP macros to specify different options and show the resulting changes to the plot. Although these sample programs are specific to the WRIGHT11.DAT example, they can be adapted to other data sets. Specifically, copy the WRIGHT6.DP and WRIGLEVE.DP macros to your own directory (and rename them if appropriate) and do the following:
The Program examples below contain copies of the WRIGLEVE.DP (since this typically change when the data changes) and WRIGOPTI.DP (to show what options can be specified) macros. The others are not shown here as they are typically not modified, but they can be viewed with the LIST <name> command where <name> is the name of the desired program.
Friendly (2000), "Visualizing Categorical Data," SAS Institute Inc., p. 90.
2010/1: Added "uncertainty" option for binomial proportions 2010/1: Option to leave axis variables uncoded 2010/6: Added CHARACTER TABULATION PLOT option 2010/6: Support for "sorted" option for two group-id variables 2010/8: Support for row/column "minmax" option for CHARACTER TABULATION PLOT case
. Demonstrate most basic usage
.
. Step 1: Read the data and extract distinct values
.
skip 25
read wright11.dat pressure angle wing
let angled = distinct angle
let nangle = size angled
let wingd = distinct wing
let nwing = size wingd
.
. Step 2: Set titles, labels, and axis options
.
title case asis
title offset 2
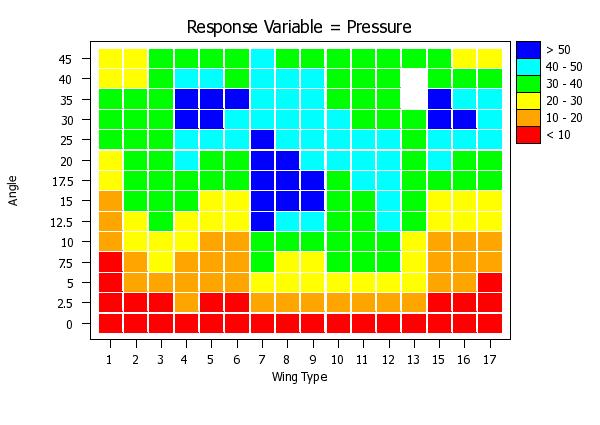
title Response Variable = Pressure
label case asis
x1label Wing Type
y1label uc()Alc()ngle
y1label displacement 12
tic offset units data
x1limits 1 nwing
major xtic mark number nwing
minor xtic mark number 0
xtic mark offset 0.8 0.8
x1tic mark label format alpha
x1tic mark label content 1 2 3 4 5 6 7 8 9 10 11 12 13 15 16 17
y1limits 1 nangle
major ytic mark number nangle
minor ytic mark number 0
y1tic mark offset 0.8 0.8
y1tic mark label format alpha
y1tic mark label content 0 2.5 5 7.5 10 12.5 15 17.5 20 25 30 35 40 45
.
. Step 3: generate the tabulation plot
.
let ylevel = data 10 20 30 40 50
region fill on all
region fill color red orange yellow green cyan blue
region border color red orange yellow green cyan blue
line color red orange yellow green cyan blue
.
tabulation mean plot pressure angle wing ylevel
.
. Step 4: Generate a legend for the plot
.
box fill pattern solid
box shadow hw 0 0
.
box fill color blue
box 86 90 90 86
move 91 87; text > 50
.
box fill color cyan
box 86 86 90 82
move 91 83; text 40 - 50
.
box fill color green
box 86 82 90 78
move 91 79; text 30 - 40
.
box fill color yellow
box 86 78 90 74
move 91 75; text 20 - 30
.
box fill color orange
box 86 74 90 70
move 91 71; text 10 - 20
.
box fill color red
box 86 70 90 66
move 91 67; text < 10
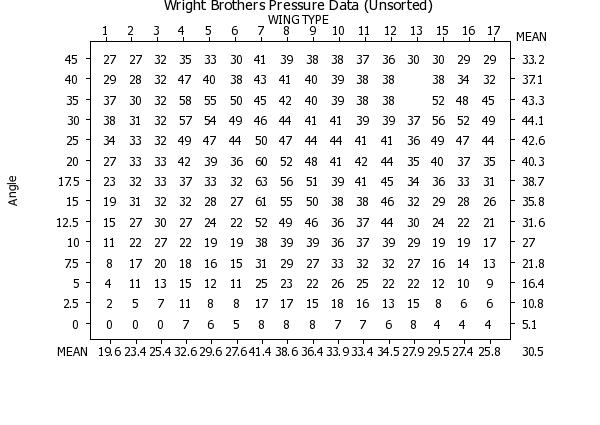
 Program 2:
. Demonstrate the most basic format
.
dimension 40 columns
.
. Step 1: Read the Wright brothers data and define title, axis labels,
. and tic mark labels
.
skip 25
read wright11.dat y x1 x2
.
let x1d = distinct x1
let ny = size x1d
let x2d = distinct x2
let nx = size x2d
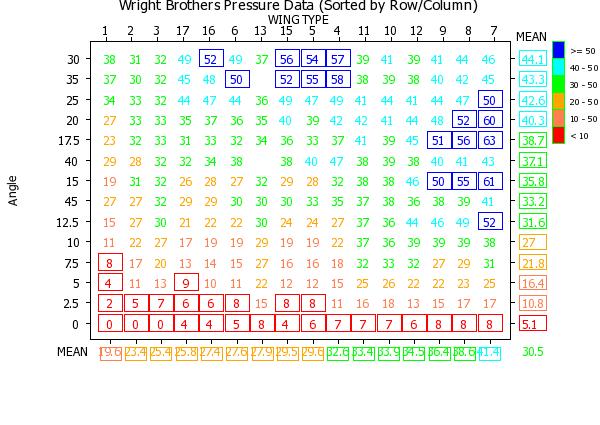
let string stitle = Wright Brothers Pressure Data
let string sylab = uc()Alc()ngle
let string sxlab = Wing Type
.
let string sy1 = 0
let string sy2 = 2.5
let string sy3 = 5
let string sy4 = 7.5
let string sy5 = 10
let string sy6 = 12.5
let string sy7 = 15
let string sy8 = 17.5
let string sy9 = 20
let string sy10 = 25
let string sy11 = 30
let string sy12 = 35
let string sy13 = 40
let string sy14 = 45
.
loop for k = 1 1 13
let string sx^k = ^k
end of loop
let string sx14 = 15
let string sx15 = 16
let string sx16 = 17
.
. Step 2: Define the contouring levels and associated attributes
.
call wrigleve.dp
.
. Step 3: Define desired options for the CHARACTER TABULATION PLOT
.
let highflag = 0
call wrigopti.dp
.
. Step 3: Define row/column marginal values for statistic
.
set let cross tabulate collapse
let rowmean = cross tabulate ^zzzzstat y x1
let colmean = cross tabulate ^zzzzstat y x2
let rowmeanr = rank index rowmean
let colmeanr = rank index colmean
.
. Step 4: Set plot control options
.
call wrigplcn.dp
.
. Step 5: Generate the character tabulation plot
.
. Box around lowest and highest levels
.
if sortflag = 1
set tabulation plot sort row
else if sortflag = 2
set tabulation plot sort column
else if sortflag = 3
set tabulation plot sort on
end of if
if direrow = 1
set tabulation plot row sort direction descending
end of if
if direcol = 1
set tabulation plot column sort direction descending
end of if
.
. Row/Column Minimum/Maximum Option
.
if minmax = 1
set tabulation plot row minmax on
end of if
if minmax = 2
set tabulation plot column minmax on
end of if
.
character color ^scolor
character hw ^ssize
character ^sstyle
line blank all
.
character tabulation mean plot y x1 x2 ylevel
.
. Step 6: Draw row/column marginal values and legend
.
if margflag = 1
call wrigmarg.dp
end of if
.
if legeflag = 1
call wriglege.dp
end of if
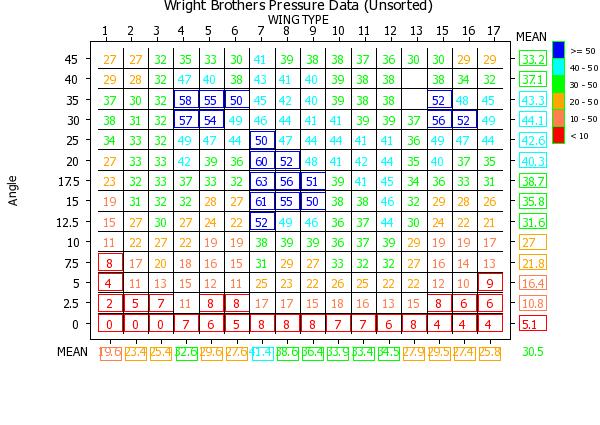
 Program 3:
.  Demonstrate the "highlight" option
.
dimension 40 columns
.
.  Step 1: Read the Wright brothers data and define title, axis labels,
.          and tic mark labels
.
skip 25
read wright11.dat y x1 x2
.
let x1d = distinct x1
let ny = size x1d
let x2d = distinct x2
let nx = size x2d
let string stitle = Wright Brothers Pressure Data
let string sylab = uc()Alc()ngle
let string sxlab = Wing Type
.
let string sy1 = 0
let string sy2 = 2.5
let string sy3 = 5
let string sy4 = 7.5
let string sy5 = 10
let string sy6 = 12.5
let string sy7 = 15
let string sy8 = 17.5
let string sy9 = 20
let string sy10 = 25
let string sy11 = 30
let string sy12 = 35
let string sy13 = 40
let string sy14 = 45
.
loop for k = 1 1 13
    let string sx^k = ^k
end of loop
let string sx14 = 15
let string sx15 = 16
let string sx16 = 17
.
.  Step 2: Define the contouring levels and associated attributes
.
call wrigleve.dp
.
.  Step 3: Define desired options for the CHARACTER TABULATION PLOT
.
let highflag = 1
let seprow = 1
let sepcol = 1
call wrigopti.dp
.
.  Step 3: Define row/column marginal values for statistic
.
set let cross tabulate collapse
let rowmean = cross tabulate ^zzzzstat y x1
let colmean = cross tabulate ^zzzzstat y x2
let rowmeanr = rank index rowmean
let colmeanr = rank index colmean
.
.  Step 4: Set plot control options
.
call wrigplcn.dp
.
.  Step 5: Generate the character tabulation plot
.
.          Box around lowest and highest levels
.
if sortflag = 1
   set tabulation plot sort row
else if sortflag = 2
   set tabulation plot sort column
else if sortflag = 3
   set tabulation plot sort on
end of if
if direrow = 1
   set tabulation plot row sort direction descending
end of if
if direcol = 1
   set tabulation plot column sort direction descending
end of if
.
.          Row/Column Minimum/Maximum Option
.
if minmax = 1
   set tabulation plot row minmax on
end of if
if minmax = 2
   set tabulation plot column minmax on
end of if
.
character color ^scolor
character hw ^ssize
character ^sstyle
line blank all
.
character tabulation mean plot y x1 x2 ylevel
.
.  Step 6: Draw row/column marginal values and legend
.
if margflag = 1
   call wrigmarg.dp
end of if
.
if legeflag = 1
   call wriglege.dp
end of if
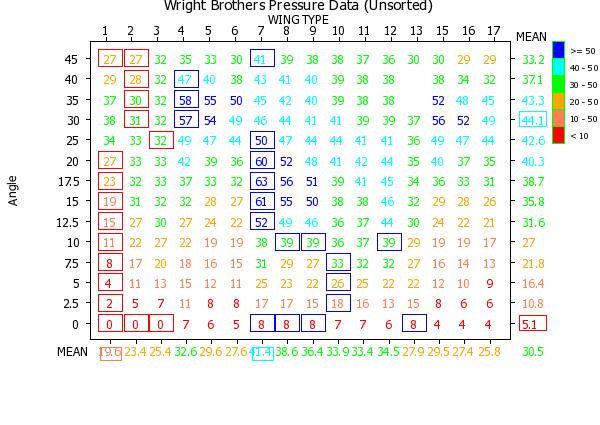
 Program 4:
.  Demonstrate the "row MIN/MAX" option
.
dimension 40 columns
.
.  Step 1: Read the Wright brothers data and define title, axis labels,
.          and tic mark labels
.
skip 25
read wright11.dat y x1 x2
.
let x1d = distinct x1
let ny = size x1d
let x2d = distinct x2
let nx = size x2d
let string stitle = Wright Brothers Pressure Data
let string sylab = uc()Alc()ngle
let string sxlab = Wing Type
.
let string sy1 = 0
let string sy2 = 2.5
let string sy3 = 5
let string sy4 = 7.5
let string sy5 = 10
let string sy6 = 12.5
let string sy7 = 15
let string sy8 = 17.5
let string sy9 = 20
let string sy10 = 25
let string sy11 = 30
let string sy12 = 35
let string sy13 = 40
let string sy14 = 45
.
loop for k = 1 1 13
    let string sx^k = ^k
end of loop
let string sx14 = 15
let string sx15 = 16
let string sx16 = 17
.
.  Step 2: Define the contouring levels and associated attributes
.
call wrigleve.dp
.
.  Step 3: Define desired options for the CHARACTER TABULATION PLOT
.
let minmax = 1
let minmaxla = 1
call wrigopti.dp
.
.  Step 3: Define row/column marginal values for statistic
.
set let cross tabulate collapse
let rowmean = cross tabulate ^zzzzstat y x1
let colmean = cross tabulate ^zzzzstat y x2
let rowmeanr = rank index rowmean
let colmeanr = rank index colmean
.
.  Step 4: Set plot control options
.
call wrigplcn.dp
.
.  Step 5: Generate the character tabulation plot
.
.          Box around lowest and highest levels
.
if sortflag = 1
   set tabulation plot sort row
else if sortflag = 2
   set tabulation plot sort column
else if sortflag = 3
   set tabulation plot sort on
end of if
if direrow = 1
   set tabulation plot row sort direction descending
end of if
if direcol = 1
   set tabulation plot column sort direction descending
end of if
.
.          Row/Column Minimum/Maximum Option
.
if minmax = 1
   set tabulation plot row minmax on
end of if
if minmax = 2
   set tabulation plot column minmax on
end of if
.
character color ^scolor
character hw ^ssize
character ^sstyle
line blank all
.
character tabulation mean plot y x1 x2 ylevel
.
.  Step 6: Draw row/column marginal values and legend
.
if margflag = 1
   call wrigmarg.dp
end of if
.
if legeflag = 1
   call wriglege.dp
end of if
 Program 5:
.  Demonstrate the "SORT" option on both rows and columns
.
dimension 40 columns
.
.  Step 1: Read the Wright brothers data and define title, axis labels,
.          and tic mark labels
.
skip 25
read wright11.dat y x1 x2
.
let x1d = distinct x1
let ny = size x1d
let x2d = distinct x2
let nx = size x2d
let string stitle = Wright Brothers Pressure Data
let string sylab = uc()Alc()ngle
let string sxlab = Wing Type
.
let string sy1 = 0
let string sy2 = 2.5
let string sy3 = 5
let string sy4 = 7.5
let string sy5 = 10
let string sy6 = 12.5
let string sy7 = 15
let string sy8 = 17.5
let string sy9 = 20
let string sy10 = 25
let string sy11 = 30
let string sy12 = 35
let string sy13 = 40
let string sy14 = 45
.
loop for k = 1 1 13
    let string sx^k = ^k
end of loop
let string sx14 = 15
let string sx15 = 16
let string sx16 = 17
.
.  Step 2: Define the contouring levels and associated attributes
.
call wrigleve.dp
.
.  Step 3: Define desired options for the CHARACTER TABULATION PLOT
.
let highflag = 1
let sortflag = 3
call wrigopti.dp
.
.  Step 3: Define row/column marginal values for statistic
.
set let cross tabulate collapse
let rowmean = cross tabulate ^zzzzstat y x1
let colmean = cross tabulate ^zzzzstat y x2
let rowmeanr = rank index rowmean
let colmeanr = rank index colmean
.
.  Step 4: Set plot control options
.
call wrigplcn.dp
.
.  Step 5: Generate the character tabulation plot
.
.          Box around lowest and highest levels
.
if sortflag = 1
   set tabulation plot sort row
else if sortflag = 2
   set tabulation plot sort column
else if sortflag = 3
   set tabulation plot sort on
end of if
if direrow = 1
   set tabulation plot row sort direction descending
end of if
if direcol = 1
   set tabulation plot column sort direction descending
end of if
.
.          Row/Column Minimum/Maximum Option
.
if minmax = 1
   set tabulation plot row minmax on
end of if
if minmax = 2
   set tabulation plot column minmax on
end of if
.
character color ^scolor
character hw ^ssize
character ^sstyle
line blank all
.
character tabulation mean plot y x1 x2 ylevel
.
.  Step 6: Draw row/column marginal values and legend
.
if margflag = 1
   call wrigmarg.dp
end of if
.
if legeflag = 1
   call wriglege.dp
end of if
 Program 6:
. Name:    WRIGLEVE.DP
. Purpose: Define the levels and associated attributes for the
.          contouring
.
FEEDBACK SAVE
FEEDBACK OFF
.
.  Step 1: Define the levels in YLEVEL
.
let ylevel = data 10 20 30 40 50
let nlevel = size ylevel
let nlevel2 = nlevel + 1
.
.  Step 2: Define the
.
.            1) colors for each level
.            2) background styles for each level
.            3) character size for background (charh1) and value (charh2)
.
let string color1 = red
let string color2 = coral
let string color3 = orange
let string color4 = green
let string color5 = cyan
let string color6 = blue
.
let string style1 = box
let string style2 = blank
let string style3 = blank
let string style4 = blank
let string style5 = blank
let string style6 = box
.
let charh1 = 4
let charw1 = 4
let charh2 = 2
let charw2 = 2
.
FEEDBACK RESTORE
Program 7:
. Name:    WRIGOPTI.DP
. Purpose: Define options for CHARACTER TABULATION PLOT for
.          the Wright brothers data.  Modify these to modify
.          what type of plot is drawn.  Note that certain options
.          are incompatible, so some options may override others.
.
.          margflag = 1    => Print marginal (i.e., row and column)
.                             values of statistic on right and bottom axes
.                   = 0    => Omit these marginal statistics
.          legeflag = 1    => Print a legend defining color labels
.                   = 0    => Omit this legend
.          sortflag = 0    => Unsorted
.                   = 1    => Sort on rows only
.                   = 2    => Sort on columns only
.                   = 3    => Sort on both rows and columns
.          minmax   = 1    => Highlight row minimum and maximum cells
.                     2    => Highlight column minimum and maximum cells
.                     0    => Do not highlight row/column minimum and
.                             maximum cells
.                             If "1" or "2", then turn off row/column sort
.          highflag = 1    => Highlighting turned on
.                   = 0    => Highlighting turned off
.          direrow  = 0    => Row direction ascending
.                   = 1    => Row direction descending
.          direcol  = 0    => Column direction ascending
.                   = 1    => Column direction descending
.          seprow   = 0    => Omit lines separating rows
.                   = 1    => Draw horizontal lines to separate rows
.          sepcol   = 0    => Omit lines separating columns
.                   = 1    => Draw lines separating columns
.          minmaxla = 0    => Do not highlight row/column minmax
.                             tic mark labels
.                   = 1    => Highlight row/column minmax tic mark labels
.          cpuflag  = 1    => Print CPU time on plot
.                   = 0    => Do not print cpu time on plot
.          zzzzstat =      => String defining desired statistic to plot
.                             (typically the mean for this type of plot)
.
FEEDBACK SAVE
FEEDBACK OFF
.
.  Step 1: Define which options you want
.
.          If the parameter exists (i.e., user sets before calling),
.          then use that value.  Otherwise, use the default value.
.
if margflag not exist
   . let margflag = 0
   let margflag = 1
end of if
.
if legeflag not exist
   . let legeflag = 0
   let legeflag = 1
end of if
.
if highflag not exist
   . let highflag = 0
   let highflag = 1
end of if
if highflag = 0
   let legeflag = 0
end of if
.
if sortflag not exist
   let sortflag = 0
   . let sortflag = 1
   . let sortflag = 2
   . let sortflag = 3
end of if
.
if direrow not exist
   let direrow = 0
   . let direrow = 1
end of if
.
if direcol not exist
   let direcol = 0
   . let direcol = 1
end of if
.
if seprow not exist
   let seprow = 0
   . let seprow = 1
end of if
.
if sepcol not exist
   let sepcol = 0
   . let sepcol = 1
end of if
.
if minmaxla not exist
   let minmaxla = 0
   . let minmaxla = 1
end of if
if margflag = 0
   let minmaxla = 0
end of if
.
if minmax not exist
   let minmax = 0
   . let minmax = 1
   . let minmax = 2
end of if
.
if cpuflag not exist
   let cpuflag = 0
   . let cpuflag = 1
end of if
.
if minmax > 0
   let sortflag = 0
   let highflag = 1
end of if
.
let irow = 0
if sortflag =  1
   let irow = 1
end of if
if sortflag =  3
   let irow = 1
end of if
let icol = 0
if sortflag =  2
   let icol = 1
end of if
if sortflag =  3
   let icol = 1
end of if
.
if zzzzstat not exist
   let string zzzzstat = MEAN
end of if
let string sp = sp()
.
FEEDBACK RESTORE
Date created: 09/09/2010 |
Last updated: 12/04/2023 Please email comments on this WWW page to [email protected]. | ||||||||||||||||||||||||