SED navigation bar go to SED home page go to Dataplot home page go to NIST home page SED Home Page SED Staff SED Projects SED Products and Publications Search SED Pages
Dataplot Vol 1 Vol 2

TRUNCATED INFORMATIVE QUANTILE PLOT

Name:
    TRUNCATED INFORMATIVE QUANTILE PLOT
Type:
    Graphics Command
Purpose:
    Generates a truncated informative quantile plot.
Description:
    Given a response variable, the truncated informative quantile plot can be used to identify which location-scale distribution best fits that data. In the context of the MIL-HANDBOOK-17, it is used to distinguish whether the data is most consistent with a normal, a 2-parameter lognormal, or a 2-parameter Weibull distribution.

    A univariate location-scale parametric distribution is one where the cumulative distribution function can be described as

      \( F(x) = F_{0}(\frac{x-a}{b}) \)

    with a and b denoting the location and scale parameters, respectively and F0 denotes the "standard" distribution (i.e., the location parameter is 0 and the scale parameter is 1). This means the distribution has no shape parameters. The 2-parameter lognormal is handled by taking the log of the data and then using the normal distribution. Similarly, the 2-parameter Weibull is handled by taking the log of the data and using the Gumbel distribution.

    The estimated IQ function is defined by

      \( \hat{\mbox{IQ}} = \frac{\hat{\mbox{Q}}(u) - \hat{\mbox{Q}}(0.5)} {\hat{\mbox{Q}}(0.75) - \hat{\mbox{Q}}(02.5)} \)

    where Q(u) is the estimated quantile function (enter HELP EMPIRICAL QUANTILE PLOT for details). The corresponding exact function, denoted by IQ(u), replaces \( \hat{\mbox{Q}} \) with Q in the above formula. The estimated \( \hat{\mbox{IQ}} \) values are determined from the data while the exact IQ values are determined from a theoretical location-scale distribution (e.g., the normal, uniform, or Gumbel).

    The estimated truncated IQ function is defined by

      \( \hat{TIQ} = \left( \begin{array}{cl} -1 & \mbox{if} \hspace{0.25in} \hat{\mbox{IQ}} \le -1 \\ \hat{\mbox{IQ}}(u) & \mbox{if} \hspace{0.25in} -1 < \hat{\mbox{IQ}} \le -1 \\ 1 & \mbox{if} \hspace{0.25in} \hat{\mbox{IQ}} > 1 \end{array} \right. \)

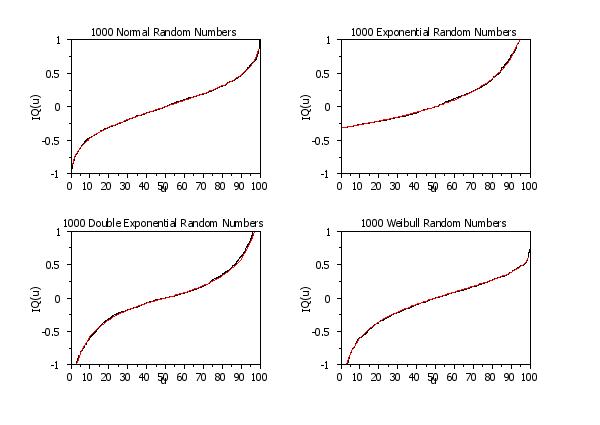
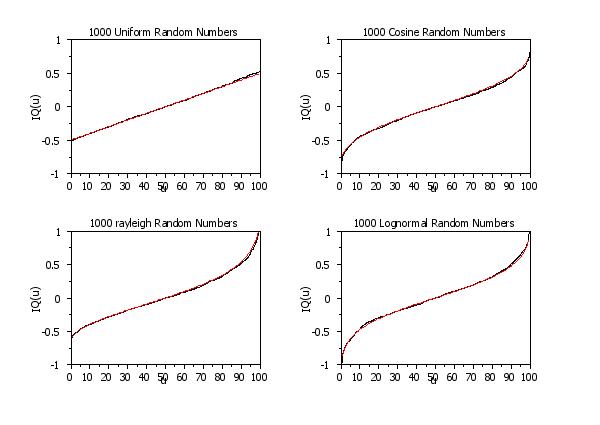
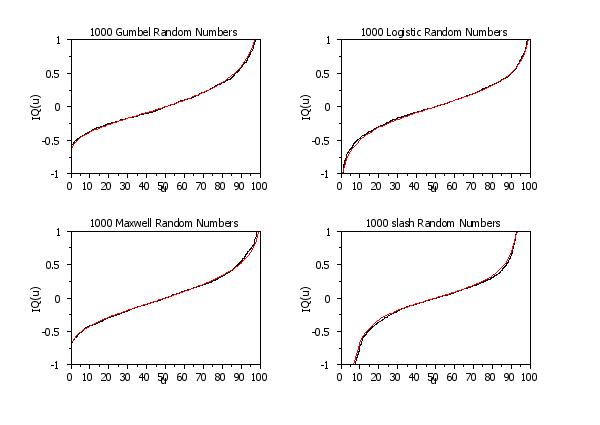
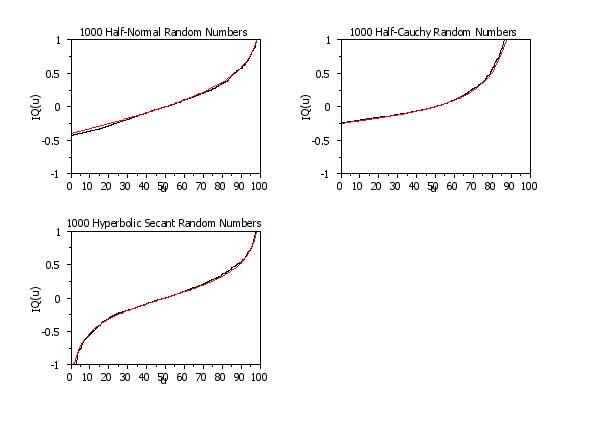
    This command plots the estimated truncated IQ function versus u and also plots the IQ function versus u for a specified theoretical distribution. The curve based on the data is compared to the curve for the theoretical distribution. The curve based on the data will typically be less smooth. However, the curves can be compared for general shape and tail behavior.

    Although the MIL-HANDBOOK-17 is primarily concerned with the normal, 2-parameter lognormal, and 2-parameter Weibull distributions, Dataplot supports this command for 19 different distributions.

    These plots are suggested as exploratory data analysis techniques in the MIL-HANDBK-17 (2002 edition). They were originally suggested by Parzen (see References below).

Syntax:
    <dist> TRUNCATED INFORMATIVE QUANTILE PLOT <y>
                            <SUBSET/EXCEPT/FOR qualification>
    where <dist> specifies the theoretical distribution and is one of:
        NORMAL
        LOGNORMAL
        UNIFORM
        GUMBEL
        WEIBULL
        LOGISTIC
        DOUBLE EXPONENTIAL
        CAUCHY
        SEMICIRCULAR
        COSINE
        ANGLIT
        HYPERBOLIC SECANT
        HALF-NORMAL
        ARCSINE
        EXPONENTIAL
        HALF-CAUCHY
        SLASH
        RAYLEIGH
        MAXWELL
                <y> is a response variable;
    and where the <SUBSET/EXCEPT/FOR qualification> is optional.

    Note that the 2-parameter lognormal is handled by taking the log of the data and then using the normal distribution. The 2-parameter Weibull is handled by taking the log of the data and then using the Gumbel distribution. The log of the data will be taken by the Dataplot code, so you should not take the log of the data before entering this command.

Examples:
    NORMAL TRUNCATED INFORMATIVE QUANTILE PLOT Y1
    WEIBULL TRUNCATED INFORMATIVE QUANTILE PLOT Y1
    LOGNORMAL TIQ PLOT Y1
Default:
    None
Synonyms:
    TIQ is a synonym for TRUNCATED INFORATIVE QUANTILE.
Related Commands: References:
    "MIL-HDBK-17-1F Volume 1: Guidelines for Characterization of Structural Materials", Depeartment of Defense, pp. 8-38, 8-39, 2002.

    Parzen (1983), "Informative Quantile Functions and Identification of Probability Distribution Types", Technical Report No. A-26, Texas A&M University.

Applications:
    Reliability
Implementation Date:
    2017/03
Program:
     
    . Step 1:   Define some default plot control features
    .
    title offset 2
    title case asis
    case asis
    label case asis
    line color blue red
    multiplot scale factor 2
    multiplot corner coordinates 5 5 95 95
    .
    . Step 3:   Demonstrate TIQ PLOT
    .
    y1label IQ(u)
    x1label u
    title automatic
    line solid solid
    line color black red
    character blank all
    .
    delete x
    let n = 1000
    let x1 = normal random numbers for i = 1 1 n
    let x2 = exponential random numbers for i = 1 1 n
    let x3 = double exponential random numbers for i = 1 1 n
    let gamma = 2.7
    let x4 = weibull random numbers for i = 1 1 n
    multiplot 2 2
    .
    title ^n Normal Random Numbers
    normal tiq plot x1
    .
    title ^n Exponential Random Numbers
    exponential tiq plot x2
    .
    title ^n Double Exponential Random Numbers
    double exponential tiq plot x3
    .
    title ^n Weibull Random Numbers
    weibull tiq plot x4
    .
    end of multiplot
        

    plot generated by sample program

    . let x1 = uniform random numbers for i = 1 1 n let x2 = cosine random numbers for i = 1 1 n let x3 = rayleigh exponential random numbers for i = 1 1 n let sigma = 2.7 let x4 = lognormal random numbers for i = 1 1 n multiplot 2 2 . title ^n Uniform Random Numbers uniform tiq plot x1 . title ^n Cosine Random Numbers cosine tiq plot x2 . title ^n rayleigh Random Numbers rayleigh tiq plot x3 . title ^n Lognormal Random Numbers lognormal tiq plot x4 . end of multiplot

    plot generated by sample program

    . let x1 = gumbel random numbers for i = 1 1 n let x2 = logistic random numbers for i = 1 1 n let x3 = maxwell random numbers for i = 1 1 n let x4 = slash random numbers for i = 1 1 n . multiplot 2 2 . title ^n Gumbel Random Numbers gumbel tiq plot x1 . title ^n Logistic Random Numbers logistic tiq plot x2 . title ^n Maxwell Random Numbers maxwell tiq plot x3 . title ^n slash Random Numbers slash tiq plot x4 . end of multiplot

    plot generated by sample program

    . let x1 = cauchy random numbers for i = 1 1 n let r = 1 let x2 = semi-circular random numbers for i = 1 1 n let x3 = anglit random numbers for i = 1 1 n let x4 = arcsine random numbers for i = 1 1 n multiplot 2 2 . title ^n Cauchy Random Numbers cauchy tiq plot x1 . title ^n Anglit Random Numbers anglit tiq plot x3 . title ^n Arcsine Random Numbers arcsine tiq plot x4 . end of multiplot

    plot generated by sample program

    . let x1 = half-normal random numbers for i = 1 1 n let x2 = half-cauchy random numbers for i = 1 1 n let x3 = hyperbolic secant exponential random numbers for i = 1 1 n multiplot 2 2 . title ^n Half-Normal Random Numbers half-normal tiq plot x1 . title ^n Half-Cauchy Random Numbers half-cauchy tiq plot x2 . title ^n Hyperbolic Secant Random Numbers hyperbolic secant tiq plot x3 . end of multiplot

    plot generated by sample program
Date created: 06/29/2017
Last updated: 12/04/2023

Please email comments on this WWW page to alan.heckert@nist.gov.