
|
|
PERCENT AGREEName:
For example, if we have two sensors that either detect or do not detect the presence of some quantity of interest, how often do the two detectors agree? This command is typically used when there a discrete number of values for the variable. Often this will be two (e.g., Yes/No type data), but it is not restricted to two. If you want to compare values for two response variables when the data is continuous, the YOUDEN PLOT is recommended.
where <y1> is the first response variable; <y2> is the second response variable; <par> is a parameter where the percent agree is saved; and where the <SUBSET/EXCEPT/FOR qualification> is optional.
LET A = PERCENT AGREE Y1 Y2 SUBSET TAG > 1
. Step 1: Read the Data
.
. Column 1: Method 1 (low => live cell, high => dead cell)
. Column 2: Method 2 (high => live cell, low => dead cell)
.
dimension 40 columns
read percmat intensity
7.1 39.8
8.5 29.6
72.7 4.2
32.3 12.3
5.4 21.5
71.1 4.4
100.0 13.5
55.0 22.4
15.0 25.9
8.7 38.5
0.9 16.6
19.0 48.5
100.0 4.3
100.0 7.9
5.2 42.6
21.8 47.2
90.0 1.0
2.0 23.5
98.0 2.2
100.0 6.2
100.0 2.0
100.0 5.6
100.0 3.0
30.0 14.3
100.0 1.0
end of data
.
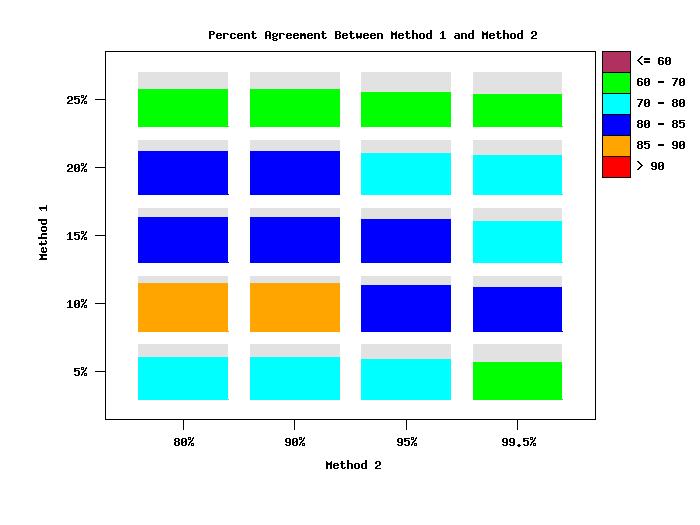
. Step 3: Generate fluctuation plot based on different levels of
. the 2 methods
.
. Use intensity levels of 5%, 10%, 15%, 20%, 25%
. Use percent matching levels of 80%, 90%, 95%, 99.5%
.
let n = size intensity
let intcut = data 5 10 15 20 25
let nint = size intcut
let matcut = data 80 90 95 99.5
let nmat = size matcut
.
let int2 = intensity
let mat2 = percmat
let xgroup = 1 for i = 1 1 n
let ygroup = 1 for i = 1 1 n
let icnt = 0
.
loop for k = 1 1 nint
let acut = intcut(k)
loop for l = 1 1 nmat
let bcut = matcut(l)
let icnt = icnt + 1
if icnt = 1
let xgroupal = xgroup
let ygroupal = ygroup
let intcor = 0 for i = 1 1 n
let intcor = 1 subset int2 > acut
let intall = intcor
let matcor = 0 for i = 1 1 n
let matcor = 1 subset mat2 < bcut
let matall = matcor
else
let xgroup2 = k for i = 1 1 n
extend xgroupal xgroup2
let ygroup2 = l for i = 1 1 n
extend ygroupal ygroup2
let intcor = 0 for i = 1 1 n
let intcor = 1 subset int2 > acut
extend intall intcor
let matcor = 0 for i = 1 1 n
let matcor = 1 subset mat2 < bcut
extend matall matcor
end of if
end of loop
end of loop
.
label case asis
tic mark label case asis
title case asis
title offset 2
.
title Percent Agreement Between Method 1 and Method 2
y1label Method 1
x1label Method 2
tic offset units data
xlimits 1 nmat
major xtic mark number nmat
minor xtic mark number 0
xtic mark offset 0.7 0.7
x1tic mark label format alpha
x1tic mark label content 80% 90% 95% 99.5%
ylimits 1 nint
major ytic mark number nint
minor ytic mark number 0
ytic mark offset 0.7 0.7
y1tic mark label format alpha
y1tic mark label content 5% 10% 15% 20% 25%
.
let ylevel = data 60 70 80 85 90 101
.
let string color = g90 g20 green cyan blue orange red
line color ^color
region fill color ^color
region border color ^color
.
set fluctuation plot floor 0
set fluctuation plot ceiling 100
fluctuation percent agreement contour plot ...
intall matall xgroupal ygroupal ylevel
.
box fill pattern solid
box shadow hw 0 0
.
box fill color g20
box 86 90 90 86
move 91 87; text <= 60
.
box fill color green
box 86 86 90 82
move 91 83; text 60 - 70
.
box fill color cyan
box 86 82 90 78
move 91 79; text 70 - 80
.
box fill color blue
box 86 78 90 74
move 91 75; text 80 - 85
.
box fill color orange
box 86 74 90 70
move 91 71; text 85 - 90
.
box fill color red
box 86 70 90 66
move 91 67; text > 90
|
Privacy
Policy/Security Notice
NIST is an agency of the U.S.
Commerce Department.
Date created: 07/28/2011 | ||||||||||||||||||||||