|
|
PRECISIONName:
where n and \( \bar{x} \) denote the sample size and sample mean, respectively. Note that high variance implies low precision while low variance implies high precision. Some sources define the precision as the reciprocal of the standard deviation.
where <y> is a response variable; <par> is a parameter where the precision value is saved; and where the <SUBSET/EXCEPT/FOR qualification> is optional.
where <y1> is the first response variable; <y2> is the second response variable; <par> is a parameter where the difference of the precision values is saved; and where the <SUBSET/EXCEPT/FOR qualification> is optional.
LET PREC = PRECISION Y1 SUBSET TAG > 2
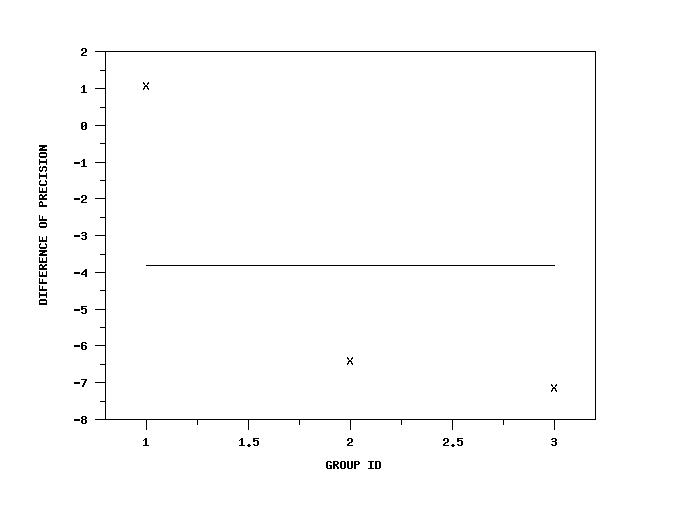
LET PREC = DIFFERENCE OF PRECISION Y1 Y2
2017/03: Added DIFFERENCE OF PRECISION
SKIP 25
READ ZARR13.DAT Y
LET P = PRECISION Y
Program 2:
. Step 1: Create the data
.
skip 25
read gear.dat y x
skip 0
.
char X
line blank
y1label Precision
x1label Group
x1tic mark offset 0.5 0.5
label case asis
title case asis
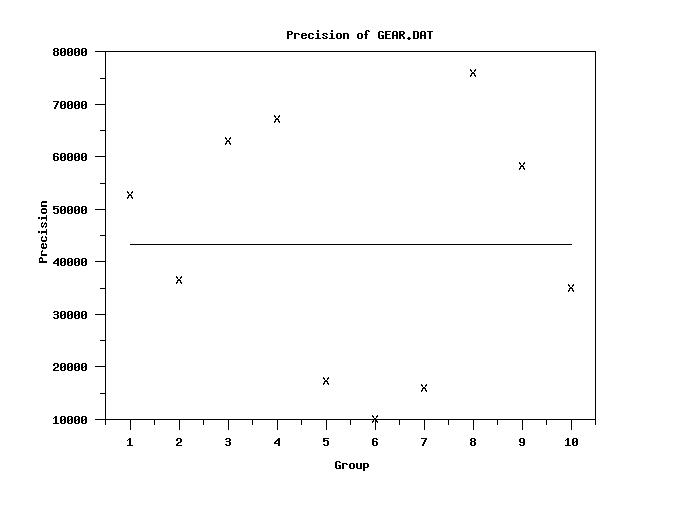
title Precision of GEAR.DAT
title offset 2
.
set statistic plot reference line average
precision plot y x
.
set write decimals 5
tabulate precision y x
SKIP 25 READ IRIS.DAT Y1 TO Y4 X . LET A = DIFFERENCE OF PRECISION Y1 Y2 SET WRITE DECIMALS 4 TABULATE DIFFERENCE OF PRECISION Y1 Y2 X 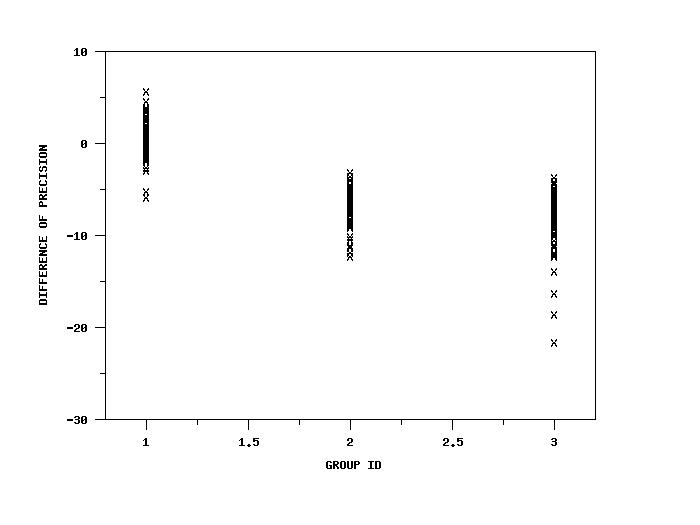
|
Privacy
Policy/Security Notice
NIST is an agency of the U.S.
Commerce Department.
Date created: 01/24/2017 | |||||||||||||