
|
|
QBIPPFName:
with p,
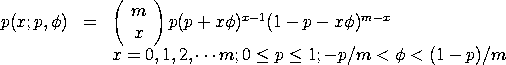
The quasi-binomial type I distribution is used to model
Bernoulli trials. The parameter p denotes the initial
probability of success, m denotes the number of Bernoulli
trials, and

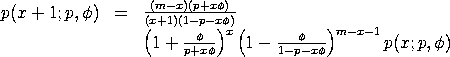
The cumulative distribution function is computed using the following recurrence relation given by Consul and Famoye:
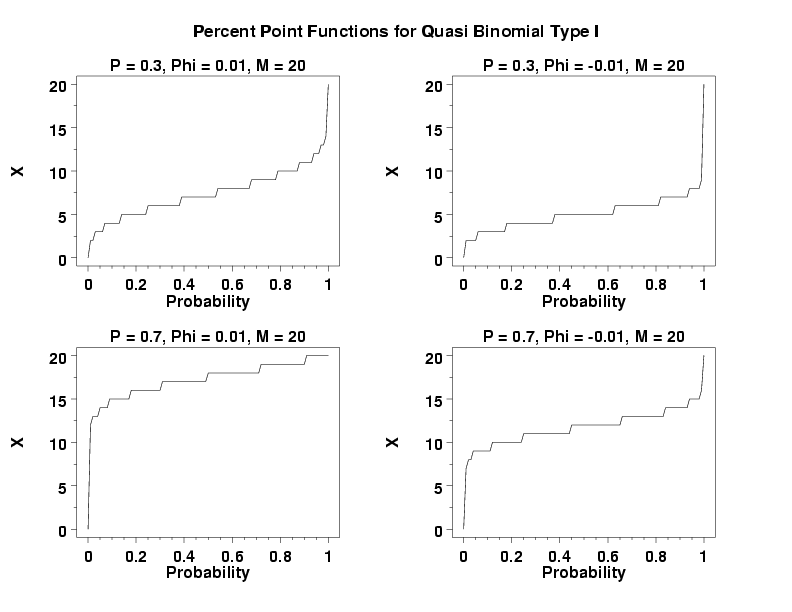
The percent point function is computed by summing the cumulative distribution function until the appropriate probability is obtained.
<SUBSET/EXCEPT/FOR qualification> where <x> is a variable, number, or parameter in the interval (0,1); <p> is a number, parameter, or variable in the range (0,1) that specifies the first shape parameter; <phi> is a number, parameter, or variable that specifies the second shape parameter; <m> is a number, parameter, or variable that specifies the third shape parameter; <y> is a variable or a parameter (depending on what <x> is) where the computed quasi binomial type I ppf value is stored; and where the <SUBSET/EXCEPT/FOR qualification> is optional.
LET Y = QBIPPF(P,0.7,0.01,20) PLOT QBIPPF(P,0.3,0.005,20) FOR P = 0 0.01 1
title size 3
tic label size 3
label size 3
legend size 3
height 3
x1label displacement 12
y1label displacement 15
.
multiplot corner coordinates 0 0 100 95
multiplot scale factor 2
label case asis
title case asis
case asis
tic offset units screen
tic offset 3 3
title displacement 2
x1label Probability
y1label X
.
xlimits 0 1
major xtic mark number 6
minor xtic mark number 3
.
multiplot 2 2
.
title P = 0.3, Phi = 0.01, M = 20
plot qbicdf(x,0.3,0.01,20) for x = 0  0.01  1
.
title P = 0.3, Phi = -0.01, M = 20
let phi = -0.01
plot qbicdf(x,0.3,phi,20) for x = 0  0.01  1
.
title P = 0.7, Phi = 0.01, M = 20
plot qbicdf(x,0.7,0.01,20) for x = 0  0.01  1
.
title P = 0.7, Phi = -0.01, M = 20
let phi = -0.01
plot qbicdf(x,0.7,phi,20) for x = 0  0.01  1
.
end of multiplot
.
justification center
move 50 97
text Percent Point Functions for Quasi Binomial Type I
Date created: 8/23/2006 |
 ,
and m denoting the shape parameters.
,
and m denoting the shape parameters.