SED navigation bar go to SED home page go to Dataplot home page go to NIST home page SED Home Page SED Staff SED Projects SED Products and Publications Search SED Pages
Dataplot Vol 2 Vol 1

QUARTILE COEFFICIENT OF DISPERSION

Name:
    QUARTILE COEFFICIENT OF DISPERSION (LET)
Type:
    Let Subcommand
Purpose:
    Compute the quartile coefficient of dispersion of a variable.
Description:
    The sample quartile coefficient of dispersion is defined as

      \( \mbox{QCD} = \frac{\mbox{Q3} - \mbox{Q1}} {\mbox{Q1} + \mbox{Q3}} \)

    where Q1 is the lower quartile (25-th percentile) and Q3 is the upper quartile (75-th percentile).

    This statistic has been suggested as a robust alternative to the coefficient of variation.

Syntax 1:
    LET <par> = QUARTILE COEFFICIENT OF DISPERSION <y>
                            <SUBSET/EXCEPT/FOR qualification>
    where <y> is a response variable;
                <par> is a parameter where the quartile coefficient of dispersion value is saved;
    and where the <SUBSET/EXCEPT/FOR qualification> is optional.
Syntax 2:
    LET <par> = DIFFERENCE OF QUARTILE COEFFICIENT OF DISPERSION <y1> <y2>
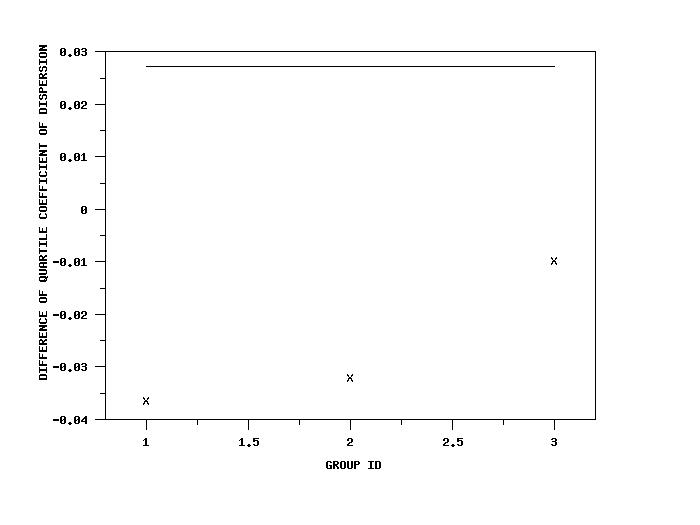
                            <SUBSET/EXCEPT/FOR qualification>
    where <y1> is the first response variable;
                <y2> is the second response variable;
                <par> is a parameter where the difference of the quartile coefficient of dispersion values is saved;
    and where the <SUBSET/EXCEPT/FOR qualification> is optional.
Examples:
    LET QCD = QUARTILE COEFFICIENT OF DISPERSION Y1
    LET QCD = QUARTILE COEFFICIENT OF DISPERSION Y1 SUBSET TAG > 2

    LET DIFFQCD = DIFFERENCE OF QUARTILE COEFFICIENT OF DISPERSION Y1 Y2

Note:
    Dataplot statistics can be used in a number of commands. For details, enter

Default:
    None
Synonyms:
    QCD
Related Commands: Reference:
    Bonett, D. G. (2006). "Confidence interval for a coefficient of quartile variation", Computational Statistics & Data Analysis, 50 (11): 2953–2957.
Applications:
    Data Analysis
Implementation Date:
    2017/01
    2017/06: Added DIFFERENCE OF QUARTILE COEFFICIENT OF DISPERSION
Program 1:
     
    SKIP 25
    READ ZARR13.DAT Y
    LET QCD = QUARTILE COEFFICIENT OF DISPERSION Y
        
Program 2:
     
    . Step 1:   Create the data
    .
    skip 25
    read gear.dat y x
    skip 0
    set write decimals 6
    .
    . Step 2:   Define plot control
    .
    title case asis
    title offset 2
    label case asis
    .
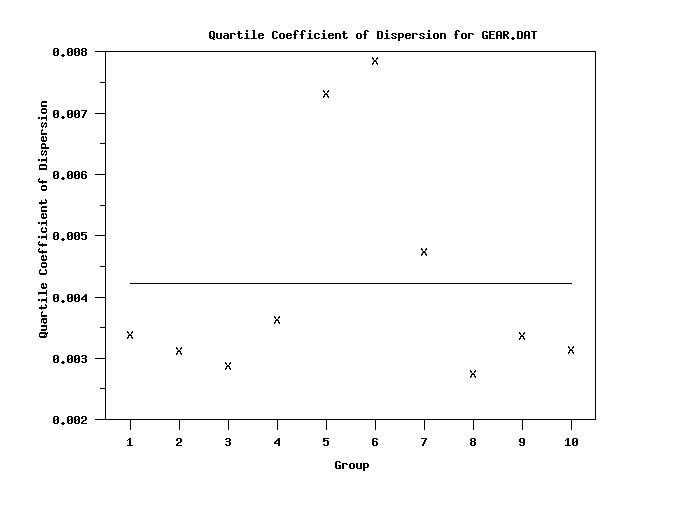
    y1label Quartile Coefficient of Dispersion
    x1label Group
    title Quartile Coefficient of Dispersion for GEAR.DAT
    let ngroup = unique x
    xlimits 1 ngroup
    major x1tic mark number ngroup
    minor x1tic mark number 0
    tic mark offset units data
    x1tic mark offset 0.5 0.5
    .
    character X
    line blank
    .
    set statistic plot reference line average
    quartile coefficient of dispersion plot y x
    .
    set write decimals 5
    tabulate quartile coefficient of dispersion y x
        
    plot generated by sample program

                Cross Tabulate QUARTILE COEFFICIENT OF DISPERSION
     
    (Response Variables: Y        )
    ---------------------------------------------
           X          |   QUARTILE COEFFI
    ---------------------------------------------
           1.000000   |          0.003385
           2.000000   |          0.003125
           3.000000   |          0.002886
           4.000000   |          0.003631
           5.000000   |          0.007318
           6.000000   |          0.007866
           7.000000   |          0.004746
           8.000000   |          0.002749
           9.000000   |          0.003378
          10.000000   |          0.003143
        
Program 3:
     
    SKIP 25
    READ IRIS.DAT Y1 TO Y4 X
    .
    LET A = DIFFERENCE OF QUARTILE COEFFICIENT OF DISPERSION Y1 Y2
    SET WRITE DECIMALS 4
    TABULATE DIFFERENCE OF QUARTILE COEFFICIENT OF DISPERSION Y1 Y2 X
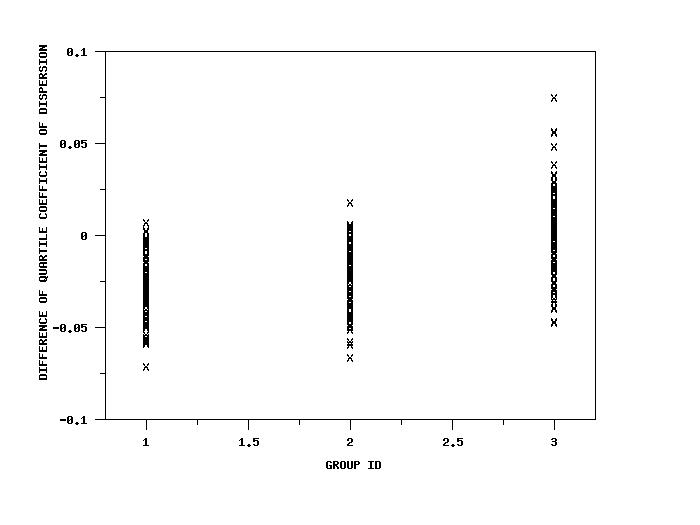
    
    
                Cross Tabulate DIFFERENCE OF QuARTILE COEFFICIENT OF DI
     
    (Response Variables: Y1       Y2      )
    ---------------------------------------------
           X          |   DIFFERENCE OF Q
    ---------------------------------------------
             1.0000   |           -0.0364
             2.0000   |           -0.0321
             3.0000   |           -0.0096
    
    . XTIC OFFSET 0.2 0.2 X1LABEL GROUP ID Y1LABEL DIFFERENCE OF QUARTILE COEFFICIENT OF DISPERSION CHAR X LINE BLANK DIFFERENCE OF COEFFICIENT OF DISPERSION PLOT Y1 Y2 X

    plot generated by sample program

    CHAR X ALL LINE BLANK ALL BOOTSTRAP DIFFERENCE OF QUARTILE COEFFICIENT OF DISPERSION PLOT ... Y1 Y2 X

    plot generated by sample program

Privacy Policy/Security Notice
Disclaimer | FOIA

NIST is an agency of the U.S. Commerce Department.

Date created: 01/24/2017
Last updated: 06/30/2017

Please email comments on this WWW page to alan.heckert@nist.gov.