
|
|
RAYPDFName:
 distribution with degrees of freedom parameter = 2 and
scale parameter
distribution with degrees of freedom parameter = 2 and
scale parameter
 . It is
also a special case of the Weibull distribution with shape
parameter = 2 and scale parameter = . It is
also a special case of the Weibull distribution with shape
parameter = 2 and scale parameter =
 .
Note that some sources may define the Rayleigh distribution as
a Weibull with shape parameter = 2 and scale parameter =
. .
Note that some sources may define the Rayleigh distribution as
a Weibull with shape parameter = 2 and scale parameter =
.
The Rayleigh distribution has the following probability density function:
with
The standard Rayleigh distribution is the case with
<SUBSET/EXCEPT/FOR qualification> where <x> is a variable or a parameter; <loc> is an optional number or parameter that specifies the value of the location parameter; <scale> is an optional positive number or parameter that specifies the value of the scale parameter; <y> is a variable or a parameter (depending on what <x> is) where the computed Rayleigh pdf value is stored; and where the <SUBSET/EXCEPT/FOR qualification> is optional.
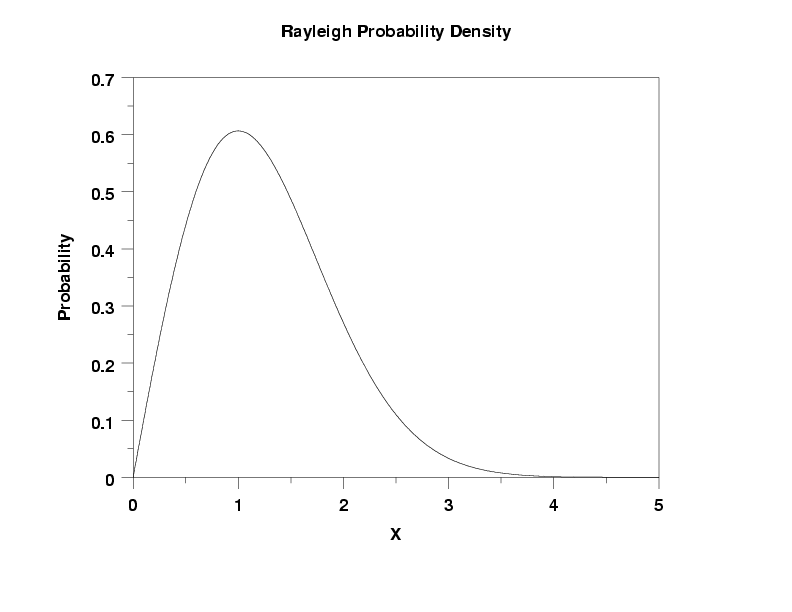
LET Y = RAYPDF(X1,0,SIGMA) PLOT RAYPDF(X,0,SIGMA) FOR X = 0.01 0.01 5
To generate a Rayleigh probability plot or a Rayleigh Kolmogorov-Smirnov or chi-square goodness of fit test, enter the following commands
RAYLEIGH KOLMOGOROV SMIRNOV GOODNESS OF FIT Y RAYLEIGH CHI-SQUARE GOODNESS OF FIT Y The location and scale parameters for the Rayleigh distribution can be estimated by generating the Rayleigh probability plot (the intercept and slope of the line fit to the probability plot, PPA0 and PPA1, are estimates of location and scale). Alternatively, you can estimate the location and scale parameters using maximum likelihood:
The maximum likelihood estimate of the scale parameter is:
![sigmahat = SQRT(SUM[i=1 to n][X(i)**2]/(2*n))](eqns/raysigmaml.gif)
with X containing the data and n denoting the
sample size. By default, Dataplot will use the sample minimum
as the estimate of location (and subtract this value from
X before computing the maximum likelihood estimate of
Y1LABEL Probability
X1LABEL X
TITLE Rayleigh Probability Density
LABEL CASE ASIS
TITLE CASE ASIS
PLOT RAYPDF(X) FOR X = 0  0.01  5
Date created: 7/7/2004 |
 and
and