
|
|
RLPName:
For ISO 13528 multi-round proficiency studies, the relative laboratory performance (RLP) for a given laboratory with N z-scores (Zi) is defined as
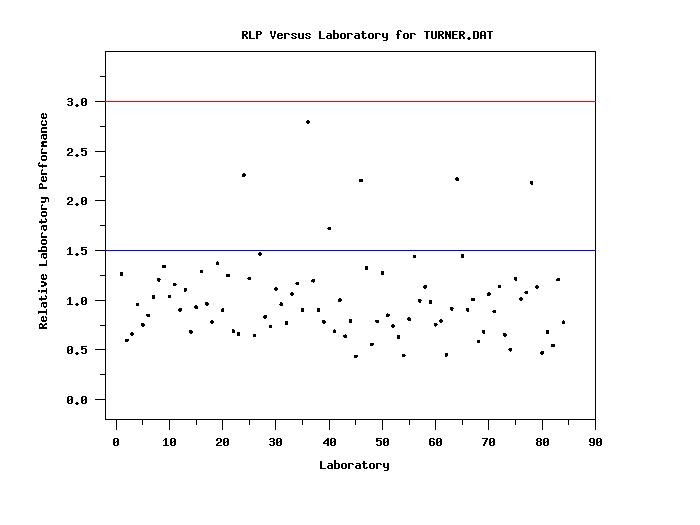
where NMAT is the number of materials. An RLP near 1 indicates average performance and an RLP greater than 1.5 indicates that the laboratory may be problematic. An advantage of this statistic is that z-scores of opposite sign do not cancel each other out. A disadvantage is that this statistic is suspectible to outliers in the z-scores. The RLP statistic is discussed in Uhlig and Lischer (1998). The RLP statistic is an examples of a combination score (i.e., the statistic is a combination of many individual z-scores). Although the ISO 13528 standard recommends against using combination scores, these can be helpful in judging the overall performance of a laboratory. These combination scores can be used to identify laboratories that are potentially problematic. These laboratories can then be examined more carefully. For example: is the poor performance due to one or a few outliers? is the lab consistently high or consistently low? does the laboratory need to carefully examine their procedures? This statistic is used to compute the RLP for a single laboratory. Note that the material-id variable is only used to determine the number of materials (NMAT in the above formula). The most typical use of this statistic is with the TABULATE command or the STATISTIC PLOT command where the group-id variable is the laboratory-id variable. For example, the command
can be used to generate a plot of the RLP values for each laboratory.
where <z> is the response variable containing z-scores; <matid> is a variable containing the material-id's; <par> is a parameter where the computed rlp is saved; and where the <SUBSET/EXCEPT/FOR qualification> is optional. The SUBSET clause can be used to specify a specific laboratory for which to compute the statistic.
LET A = RLP Z MAT SUBSET LAB = 23 TABULATE RLP Z MATID LABID RLP PLOT Z MATID LABID
To specify this value, enter the command
where <value> is typically 3 or 4 (if the reponse data are z-scores or z-score type data). Note that the value represents an absolute value. For example, if CAPVALUE is 4, values greater than 4 will be set to 4 and values less than -4 will be set to -4.
ISO 13528 (2005), "Statistical Methods for use in proficiency testing by interlaboratory comparisons," First Edition, 2005-09-01.
. Step 1:   Read the data
.
dimension 40 columns
skip 25
read turner.dat labid z year quarter matid matave
skip 0
let labcoded = code labid
.
. Step 2:   Set plot control setting
.
case asis
title case asis
title offset 2
label case asis
y1label Relative Laboratory Performance
x1label Laboratory
title RLP Versus Laboratory for TURNER.DAT
y1tic mark label decimal 1
tic mark offset units data
x1tic mark offset 2 0
y1tic mark offset 0.2 0.5
ylimits 0 3
.
line blank
character circle
character hw 0.5 0.375
character fill on
.
. Step 3:   Generate plot of RLP vs Lab
.
rlp plot z matid labcoded
line dash
line color blue
drawsdsd 15 1.5 85 1.5
line color red
drawsdsd 15 3.0 85 3.0
.
. Step 4:   Tabulate RLP values for each laboratory
.
set write decimals 4
tabulate rlp z matid labid
The following output is generated
            Cross Tabulate RELATIVE LABORATORY PERFORMANCE

(Response Variables: Z        MATID   )
---------------------------------------------
       LABID      |   RELATIVE LABORA
---------------------------------------------
         1.0000   |            1.2635
         2.0000   |            0.5968
         3.0000   |            0.6613
         4.0000   |            0.9571
         5.0000   |            0.7537
         6.0000   |            0.8483
         7.0000   |            1.0330
         8.0000   |            1.2063
         9.0000   |            1.3412
        10.0000   |            1.0391
        11.0000   |            1.1607
        12.0000   |            0.9048
        13.0000   |            1.1061
        14.0000   |            0.6820
        15.0000   |            0.9297
        16.0000   |            1.2919
        17.0000   |            0.9640
        18.0000   |            0.7816
        19.0000   |            1.3733
        20.0000   |            0.9002
        21.0000   |            1.2505
        22.0000   |            0.6907
        23.0000   |            0.6608
        24.0000   |            2.2597
        25.0000   |            1.2199
        26.0000   |            0.6441
        27.0000   |            1.4659
        28.0000   |            0.8332
        29.0000   |            0.7345
        30.0000   |            1.1149
        32.0000   |            0.9611
        33.0000   |            0.7722
        34.0000   |            1.0624
        35.0000   |            1.1702
        36.0000   |            0.9016
        37.0000   |            2.7951
        38.0000   |            1.1969
        39.0000   |            0.9013
        40.0000   |            0.7844
        41.0000   |            1.7227
        43.0000   |            0.6891
        44.0000   |            1.0015
        45.0000   |            0.6377
        46.0000   |            0.7925
        47.0000   |            0.4359
        48.0000   |            2.2051
        49.0000   |            1.3257
        50.0000   |            0.5562
        51.0000   |            0.7882
        52.0000   |            1.2762
        53.0000   |            0.8490
        54.0000   |            0.7403
        55.0000   |            0.6298
        56.0000   |            0.4445
        57.0000   |            0.8096
        58.0000   |            1.4416
        59.0000   |            0.9948
        60.0000   |            1.1370
        61.0000   |            0.9833
        62.0000   |            0.7544
        64.0000   |            0.7930
        65.0000   |            0.4510
        66.0000   |            0.9146
        67.0000   |            2.2194
        68.0000   |            1.4462
        69.0000   |            0.9027
        70.0000   |            1.0099
        71.0000   |            0.5860
        72.0000   |            0.6815
        73.0000   |            1.0609
        74.0000   |            0.8879
        75.0000   |            1.1377
        76.0000   |            0.6527
        77.0000   |            0.5023
        78.0000   |            1.2167
        79.0000   |            1.0140
        80.0000   |            1.0788
        81.0000   |            2.1828
        82.0000   |            1.1335
        83.0000   |            0.4704
        84.0000   |            0.6805
        85.0000   |            0.5462
        86.0000   |            1.2086
        87.0000   |            0.7786
|
Privacy
Policy/Security Notice
NIST is an agency of the U.S.
Commerce Department.
Date created: 02/09/2015 | |||||||||||||||||||||||||||||||||||||||||||