SED navigation bar go to SED home page go to Dataplot home page go to NIST home page SED Home Page SED Staff SED Projects SED Products and Publications Search SED Pages
Dataplot Vol 2 Vol 1

SEMPDF

Name:
    SEMPDF (LET)
Type:
    Library Function
Purpose:
    Compute the semi-circular probability density function.
Description:
    The semi-circular distribution is the distribution onto one axis of the points uniformly distributed within the unit circle. As such, it is useful for testing 2-dimensional uniformity.

    The probability density function for the semi-circular distribution is:
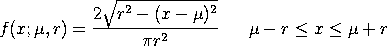
      f(x;mu,r) = 2*sqrt(r**2 - (x-mu)**2)/(PI*r**2)  mu - r <= x <= mu + r

    with mu and r denoting the location and scale parameters, respectively. The scale parameter, r, is the radius of the semi-circle (or ellipse if r not equal to 1).

    The case where mu = 0 and r = 1 is referred to as the standard semi-circular distribution and has the following probability density function:

      f(x) = 2*sqrt(1-x**2)/PI      -1 <= x <= 1

    This distribution has mean 0 and standard deviation r/4.

Syntax:
    LET <y> = SEMPDF(<x>,<mu>,<r>)
                            <SUBSET/EXCEPT/FOR qualification>
    where <x> is a variable, number, or parameter;
                <mu> is a variable, number, or parameter that specifies the location parameter;
                <r> is a variable, number, or parameter that specifies the scale parameter;
                <y> is a variable or a parameter (depending on what <x> is) where the computed semi-circular pdf value is stored;
    and where the <SUBSET/EXCEPT/FOR qualification> is optional.

    If <mu> and <r> are omitted, they default to 0 and 1, respectively.

Examples:
    LET A = SEMPDF(0.5)
    LET A = SEMPDF(1.2,0,5)
    LET X2 = SEMPDF(X1)
Note:
    Semi-circular random numbers, probability plots, and goodness of fit tests can be generated with the commands:

      LET Y = SEMI-CIRCULAR RANDOM NUMBERS FOR I = 1 1 N
      SEMI-CIRCULAR PROBABILITY PLOT Y
      SEMI-CIRCULAR PROBABILITY PLOT Y2 X2
      SEMI-CIRCULAR PROBABILITY PLOT Y3 XLOW XHIGH
      SEMI-CIRCULAR KOLMOGOROV SMIRNOV GOODNESS OF FIT Y
      SEMI-CIRCULAR CHI-SQUARE GOODNESS OF FIT Y2 X2
      SEMI-CIRCULAR CHI-SQUARE GOODNESS OF FIT Y3 XLOW XHIGH

    The location and scale estimates can be obtained from the probability plot (location = PPA0 and scale = PPA1).

    The BOOTSTRAP DISTRIBUTION command can be used to find uncertainty intervals for the location and scale parameters based on the probability plot.

Default:
    None
Synonyms:
    None
Related Commands:
    SEMCDF = Compute the semi-circular cumulative distribution function.
    SEMPPF = Compute the semi-circular percent point function.
    UNIPDF = Compute the uniform probability density function.
    UNICDF = Compute the uniform cumulative distribution function.
    UNIPPF = Compute the uniform percent point function.
    NORCDF = Compute the normal cumulative distributoin function.
    NORPDF = Compute the normal probability density function.
    NORPPF = Compute the normal percent point function.
Reference:
    Johnson and Kotz (1970), Continuous Univariate Distributions - 2, Houghton Mifflin, (chapter 25).

    Filliben (1969), Simple and Robust Linear Estimation of the Location Parameter of a Symmetric Distribution, unpublished Ph.d dissertation, Princeton University, (pp. 21-44, 229-231).

Applications:
    Distributional Modeling
Implementation Date:
    94/4: Implemented for the standard case
    2006/10: Updated to support the general case
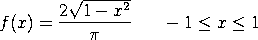
Program:
     
    XLIMITS -1 1
    XTIC OFFSET 0.1 0.1
    TITLE AUTOMATIC
    PLOT SEMPDF(X) FOR X = -1 0.01 1
        
    plot generated by sample program

Date created: 1/8/2008
Last updated: 1/8/2008
Please email comments on this WWW page to alan.heckert@nist.gov.