SED navigation bar go to SED home page go to Dataplot home page go to NIST home page SED Home Page SED Staff SED Projects SED Products and Publications Search SED Pages
Dataplot Vol 2 Vol 1

SHORTEST HALF MIDMEAN

Name:
    SHORTEST HALF MIDMEAN (LET)
Type:
    Let Subcommand
Purpose:
    Compute the shortest half midmean for a variable.
Description:
    The midmean of a variable is the mean of the observations between the 25th and 75th percentiles. The shortest half midmean uses the most compact half of the data rather than the middle half. This is essentially an asymetric version of the midmean. Although it has rather low efficiency (lower than the median), it is less sensitive to asymmetrically distributed outliers. The formula for the shortest half midmean is

      \( \mbox{Sh/mean} = \sum_{i=k}^{k+m}{\frac{x_{i}}{m}} \hspace{0.3in} \mbox{for the minimum} \hspace{0.1in} (x_{k+m} - x_{k}) \)

      \( m = n/2 \hspace{1.35in} n \mbox{ odd} \)
      \( m = \mbox{INT}(n/2) + 1 \hspace{0.5in} n \mbox{ even} \)

Syntax 1:
    LET <par> = SHORTEST HALF MIDMEAN <y>             <SUBSET/EXCEPT/FOR qualification>
    where <y> is the response variable;
                <par> is a parameter where the computed shortest half midmean is stored;
    and where the <SUBSET/EXCEPT/FOR qualification> is optional.
Syntax 2:
    LET <par> = DIFFERENCE OF SHORTEST HALF MIDMEAN <y1> <y2>
                            <SUBSET/EXCEPT/FOR qualification>
    where <y1> is the first response variable;
                <y2> is the second response variable;
                <par> is a parameter where the computed difference of shortest half midmeans is stored;
    and where the <SUBSET/EXCEPT/FOR qualification> is optional.
Examples:
    LET A = SHORTEST HALF MIDMEAN Y1
    LET A = SHORTEST HALF MIDMEAN Y1 SUBSET TAG > 2

    LET A = DIFFERENCE OF SHORTEST HALFMIDMEAN Y1 Y2

Note:
    Dataplot statistics can be used in a number of commands. For details, enter

Default:
    None
Synonyms:
    SHORTEST HALF MID MEAN is a synonym for SHORTEST HALF MIDMEAN
Related Commands: References:
    David Duewer (2008), "A Comparison of Location Estimators for Interlaboratory Data Contaminated with Value and Uncertainty Outliers", Accredited Quality Assurance, Vol. 13, pp. 193-216.

    Andrews, Bickel, Hampel, Huber, Rogers, and Tukey (1972), "Robust Estimates of Location", Princeton University Press, Princeton.

    Rousseeuw (1985), "Multivariate Estimation with High Breakdown Point", in Grossman, Pflug, Nincze, Wetrz (eds), "Mathematical Statistics and Applications", Reidel, Dordrecht, The Netherlands, pp. 283-297.

Applications:
    Robust Data Analysis
Implementation Date:
    2017/02
    2017/06: Added DIFFERENCE OF SHORTEST HALF MIDMEAN
Program 1:
     
    SKIP 25
    READ LGN.DAT Y
    LET SHMM = SHORTEST HALF MIDMEAN Y
        
Program 2:
     
    . Step 1:   Create the data
    .
    skip 25
    read gear.dat y x
    skip 0
    .
    char X
    line blank
    y1label Shortest Half Midmean
    x1label Group
    x1tic mark offset 0.5 0.5
    label case asis
    title case asis
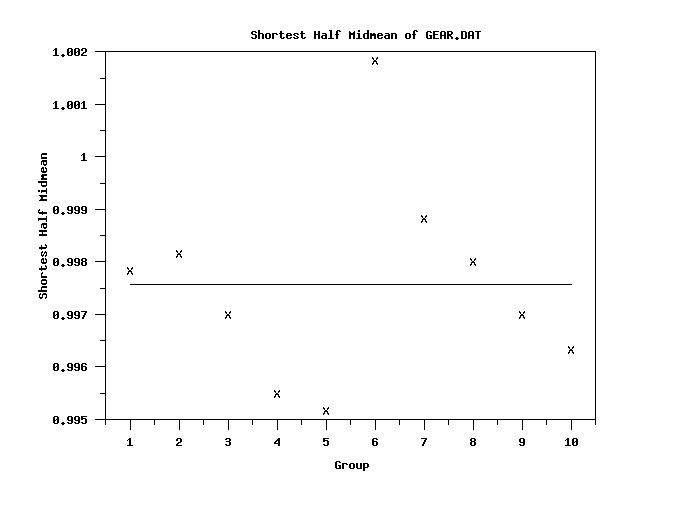
    title Shortest Half Midmean of GEAR.DAT
    title offset 2
    .
    set statistic plot reference line average
    shortest half midmean plot y x
    .
    set write decimals 5
    tabulate shortest half midmean y x
        

    The following output is generated

     
                Cross Tabulate SHORTEST HALF MIDMEAN
     
    (Response Variables: Y        )
    ---------------------------------------------
           X          |   SHORTEST HALF M
    ---------------------------------------------
            1.00000   |           0.99783
            2.00000   |           0.99817
            3.00000   |           0.99700
            4.00000   |           0.99550
            5.00000   |           0.99517
            6.00000   |           1.00183
            7.00000   |           0.99883
            8.00000   |           0.99800
            9.00000   |           0.99700
           10.00000   |           0.99633
        
    plot generated by sample program
Program 3:
     
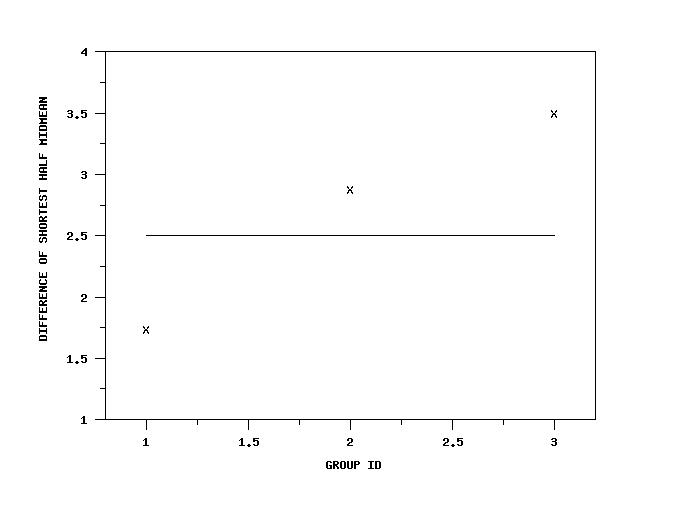
    SKIP 25
    READ IRIS.DAT Y1 TO Y4 X
    .
    LET A = DIFFERENCE OF SHORTEST HALF MIDMEAN Y1 Y2
    SET WRITE DECIMALS 4
    TABULATE DIFFERENCE OF SHORTEST HALF MIDMEAN Y1 Y2 X
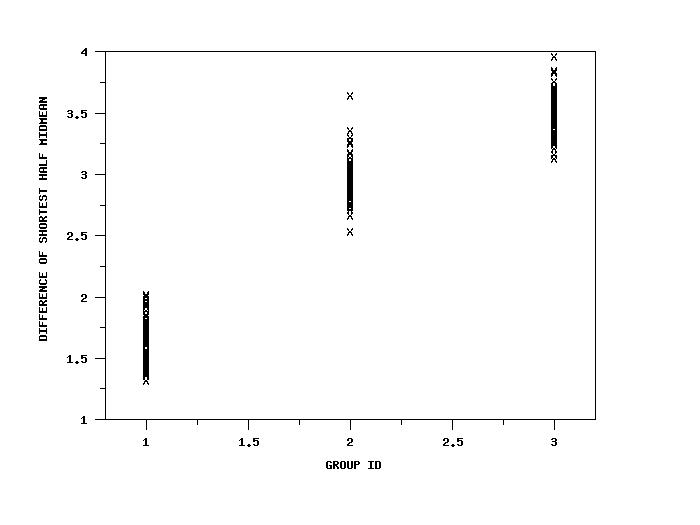
    
    
                Cross Tabulate DIFFERENCE OF SHORTEST HALF MIDMEAN
     
    (Response Variables: Y1       Y2      )
    ---------------------------------------------
           X          |   DIFFERENCE OF S
    ---------------------------------------------
             1.0000   |            1.7346
             2.0000   |            2.8769
             3.0000   |            3.4962
    
    . XTIC OFFSET 0.2 0.2 X1LABEL GROUP ID Y1LABEL DIFFERENCE OF SHORTEST HALF MIDMEAN CHAR X LINE BLANK DIFFERENCE OF SHORTEST HALF MIDMEAN PLOT Y1 Y2 X

    plot generated by sample program

    CHAR X ALL LINE BLANK ALL BOOTSTRAP DIFFERENCE OF SHORTEST HALF MIDMEAN PLOT Y1 Y2 X

    plot generated by sample program

Privacy Policy/Security Notice
Disclaimer | FOIA

NIST is an agency of the U.S. Commerce Department.

Date created: 07/03/2017
Last updated: 07/03/2017

Please email comments on this WWW page to alan.heckert@nist.gov.