|
|
SN SCALEName:
Many statistics have one of these properties. However, it can be difficult to find statistics that are both resistant and have robustness of efficiency. The most common estimate of scale, the standard deviation, is the most efficient estimate of scale if the data come from a normal distribution. However, the standard deviation is not robust in the sense that changing even one value can dramatically change the computed value of the standard deviation (i.e., poor resistance). In addition, it does not have robustness of efficiency for non-normal data. The median absolute deviation (MAD) and interquartile range are the two most commonly used robust alternatives to the standard deviation. The MAD in particular is a very robust scale estimator. However, the MAD has the following limitations:
Rousseeuw and Croux proposed the Sn estimate of scale as an alternative to the MAD. It shares desirable robustness properties with MAD (50% breakdown point, bounded influence function). In addition, it has significantly better normal efficiency (58%) and it does not depend on symmetry. The Sn scale estimate is defined as:
That is, for each i we compute the median of {|xi - xj j = 1, ..., n}. The median of these n numbers is then the estimate of Sn. The constant c is determined to make Sn a consistent estimator. The value used is 1.1926 (this is the value needed to make Sn a consistent estimator for normal data). The Sn statistic measures typical distances between values in contrast to the MAD and the standard deviation which measure the distance from a central location. This is why the Sn is appropriate for asymmetic distributions as well symmetric distributions. The Rousseeuw and Croux article (see the Reference section below) discusses the properties of the Sn estimate in detail.
where <y> is the response variable; <par> is a parameter where the computed Sn scale statistic is stored; and where the <SUBSET/EXCEPT/FOR qualification> is optional.
LET A = SN SCALE Y1 SUBSET TAG > 2
Mosteller and Tukey (1977), "Data Analysis and Regression: A Second Course in Statistics", , Addison-Wesley, pp. 203-209.
MULTIPLOT 2 2
MULTIPLOT CORNER COORDINATES 0 0 100 100
MULTIPLOT SCALE FACTOR 2
X1LABEL DISPLACEMENT 12
.
LET Y1 = NORMAL RANDOM NUMBERS FOR I = 1 1 200
LET SIGMA = 1
LET Y2 = LOGNORMAL RANDOM NUMBERS FOR I = 1 1 200
.
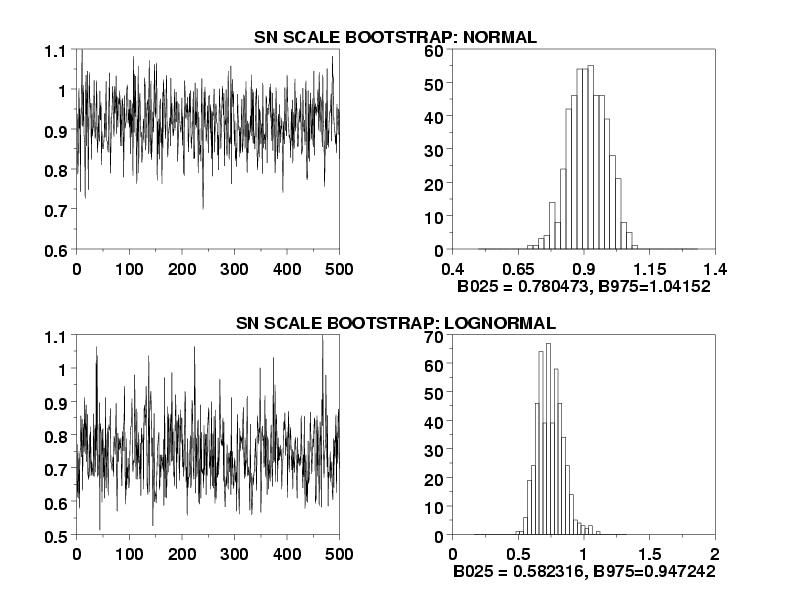
BOOTSTRAP SAMPLES 500
BOOTSTRAP SN SCALE PLOT Y1
X1LABEL B025 = ^B025, B975=^B975
HISTOGRAM YPLOT
X1LABEL
.
BOOTSTRAP SN SCALE PLOT Y2
X1LABEL B025 = ^B025, B975=^B975
HISTOGRAM YPLOT
.
END OF MULTIPLOT
JUSTIFICATION CENTER
MOVE 50 96
TEXT SN SCALE BOOTSTRAP: NORMAL
MOVE 50 46
TEXT SN SCALE BOOTSTRAP: LOGNORMAL
|
Privacy
Policy/Security Notice
NIST is an agency of the U.S.
Commerce Department.
Date created: 05/05/2003 | ||||||||||||||||||