
|
|
STATISTIC ANDERSON DARLINGName:
Although this value is normally determined using the GOODNESS OF FIT command, for a limited number of distributions you can also generate this as a statistic LET subcommand. The advantage in this case is that you can use it with any of the commands that support built-in statistics (e.g., the STATISTIC PLOT or the TABULATION command). For example, if you have groups of data, you can use the TABULATE or STATISTIC PLOT commands to easily compare the goodness of fit across the groups. In order to compute the Anderson-Darling statistic, the distribution parameters are first computed using maximum likelihood. This command can also return the maximum likelihood estimates. This command is only supported for a subset of the distributions for which the Anderson-Darling statistic is supported with the GOODNESS OF FIT command. See the Note section below for a list of distributions supported by this command.
<SUBSET/EXCEPT/FOR qualification> where <y> is a response variable; <dist> is one of the supported distributions listed below; <par> is the parameter where the AD value is saved; and where the <SUBSET/EXCEPT/FOR qualification> is optional. This syntax is used for the case where there are no shape parameters.
<SUBSET/EXCEPT/FOR qualification> where <y> is a response variable; <dist> is one of the supported distributions listed below; <par> is the parameter where the AD value is saved; and where the <SUBSET/EXCEPT/FOR qualification> is optional. This syntax is used for those distributions that have a shape parameter. When the distribution has a shape parameter, then the word STATISTIC is required to distinguish this command from the ANDERSON DARLING PLOT command. Specifically it is used to distinguish the following two cases
WEIBULL ANDERSON DARLING STATISTIC PLOT Y X The first command is the Weibull Anderson Darling plot (i.e., a plot of the Anderson-Darling goodness of fit across values of the shape parameter) while the second command plots the Anderson Darling statistic for Y for each group in X.
<SUBSET/EXCEPT/FOR qualification> where <y> is a response variable; <dist> is one of the supported distributions listed below; <par> is the parameter where the location value is saved; and where the <SUBSET/EXCEPT/FOR qualification> is optional. This syntax returns the estimate of the location parameter rather than the AD value. Not all supported distributions have a location parameter.
<SUBSET/EXCEPT/FOR qualification> where <y> is a response variable; <dist> is one of the supported distributions listed below; <par> is the parameter where the scale value is saved; and where the <SUBSET/EXCEPT/FOR qualification> is optional. This syntax returns the estimate of the scale parameter rather than the AD value.
<SUBSET/EXCEPT/FOR qualification> where <y> is a response variable; <dist> is one of the supported distributions listed below; <par> is the parameter where the shape value is saved; and where the <SUBSET/EXCEPT/FOR qualification> is optional. This syntax returns the estimate of the shape parameter rather than the AD value. Not all supported distributions have a shape parameter.
LET A = NORMAL ANDERSON DARLING LOCATION Y LET A = NORMAL ANDERSON DARLING SCALE Y
LET A = LOGISTIC ANDERSON DARLING Y
LET A = WEIBULL ANDERSON DARLING STATISTIC Y
LET A = EXPONENTIAL ANDERSON DARLING Y LET A = GUMBEL ANDERSON DARLING Y LET A = LOGISTIC ANDERSON DARLING Y LET A = MAXWELL ANDERSON DARLING Y LET A = NORMAL ANDERSON DARLING Y LET A = RAYLEIGH ANDERSON DARLING Y LET A = UNIFORM ANDERSON DARLING Y The Maxwell and Rayleigh support the 2-parameter case rather than the 1-parameter case (i.e., the location parameter will be estimated). For the uniform distribution, the scale parameter will actually return the upper limit parameter. In addition, the following distributions with a single shape parameter are supported.
LET A = FATIGUE LIFE ANDERSON DARLING STATISTIC Y LET A = FRECHET ANDERSON DARLING STATISTIC Y LET A = GAMMA ANDERSON DARLING STATISTIC Y LET A = GEOMETRIC EXTREME EXPONENTIAL ... ANDERSON DARLING STATISTIC Y LET A = INVERTED GAMMA ANDERSON DARLING STATISTIC Y LET A = LOGISTIC EXPONENTIAL ANDERSON DARLING ... STATISTIC Y LET A = LOGNORMAL ANDERSON DARLING STATISTIC Y LET A = WEIBULL ANDERSON DARLING STATISTIC Y Note that the above support the 2-parameter form of the distribution (i.e., the scale and shape parameters are estimated from the data and the location parameter is set to zero).
where <value> can be one of the following
Stephens, M. A. (1976), "Asymptotic Results for Goodness-of-Fit Statistics with Unknown Parameters," Annals of Statistics, Vol. 4, pp. 357-369. Stephens, M. A. (1977), "Goodness of Fit for the Extreme Value Distribution," Biometrika, Vol. 64, pp. 583-588. Stephens, M. A. (1977), "Goodness of Fit with Special Reference to Tests for Exponentiality," Technical Report No. 262, Department of Statistics, Stanford University, Stanford, CA. Stephens, M. A. (1979), "Tests of Fit for the Logistic Distribution Based on the Empirical Distribution Function," Biometrika, Vol. 66, pp. 591-595.
. Step 1: Read the data
.
skip 25
read nor.dat y1
read exp.dat y2
read weibbury.dat y3
read lgn.dat y4
read gamma.dat y5
read frechet.dat y6
let y x = stack y1 y2 y3 y4 y5 y6
skip 0
.
case asis
label case asis
title case asis
title offset 2
multiplot corner coordinates 2 2 98 98
multiplot scale factor 2
.
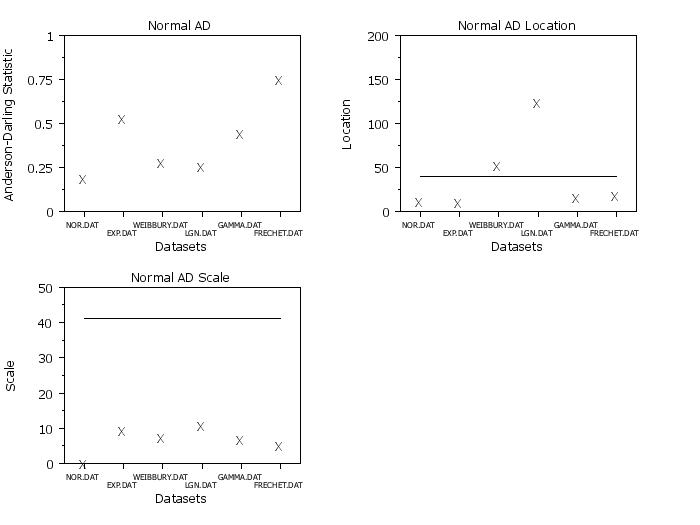
. Step 2: Plot normal a-d statistic
.
multiplot 2 2
y1label Anderson-Darling Statistic
x3label Datasets
xlimits 1 6
major xtic mark number 6
minor xtic mark number 0
x1tic mark offset 0.5 0.5
x1tic mark label format alpha
x1tic mark label content NOR.DAT sp()cr()sp()cr()EXP.DAT WEIBBURY.DAT ...
sp()cr()sp()cr()LGN.DAT GAMMA.DAT sp()cr()sp()cr()FRECHET.DAT
x1tic mark label size 1.2
y1label displacement 12
ylimits 0 1
character X
line blank
.
title Normal AD
normal anderson darling plot y x
.
ylimits
y1label Location
title Normal AD Location
normal anderson darling location plot y x
.
y1label Scale
title Normal AD Scale
normal anderson darling scale plot y x
.
. . Step 3: Location/Scale distributions . multiplot 2 2 label . ylimits 0 1 title Normal AD normal anderson darling plot y x . ylimits 0 6 title Exponential AD exponential anderson darling plot y x ylimits 0 1000 title Double Exponential AD double exponential anderson darling plot y x ylimits 0 1.5 title Gumbel (Maximum) gumbel anderson darling plot y x . end of multiplot . justification center move 50 3 text Datasets direction vertical move 2 50 text Anderson-Darling Statistic direction horizontal . 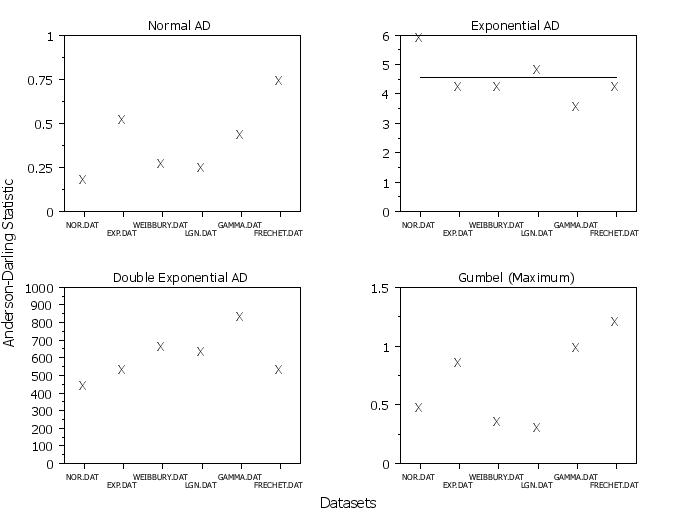
multiplot 2 2
x1tic mark label format numeric
label
.
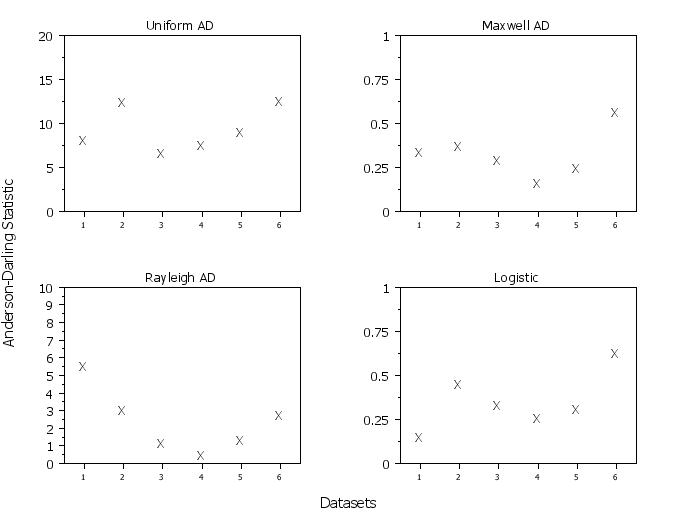
ylimits 0 20
title Uniform AD
uniform anderson darling plot y x
.
ylimits 0 1
title Maxwell AD
maxwell anderson darling plot y x
.
ylimits 0 10
title Rayleigh AD
rayleigh anderson darling plot y x
.
ylimits 0 1
title Logistic
logistic anderson darling plot y x
.
end of multiplot
.
justification center
move 50 3
text Datasets
direction vertical
move 2 50
text Anderson-Darling Statistic
direction horizontal
 Program 2:
. Step 1: Read the data
.
skip 25
read nor.dat y1
read exp.dat y2
read weibbury.dat y3
read lgn.dat y4
read gamma.dat y5
read frechet.dat y6
let y x = stack y1 y2 y3 y4 y5 y6
skip 0
.
case asis
title case asis
title offset 2
.
xlimits 1 6
major xtic mark number 6
minor xtic mark number 0
x1tic mark offset 0.5 0.5
x1tic mark label size 1.5
character X
line blank
.
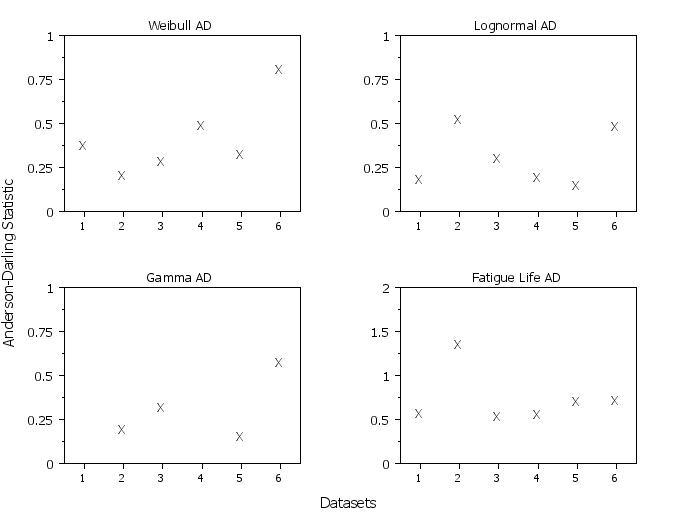
. Step 3: Weibull, Lognormal, Gamma, Fatigue Life
.
multiplot corner coordinates 2 2 98 98
multiplot scale factor 2
multiplot 2 2
x1tic mark label format numeric
label
.
ylimits 0 1
title Weibull AD
weibull anderson darling statistic plot y x
. weibull ad statistic plot y x
.
ylimits 0 1
title Lognormal AD
lognormal anderson darling statistic plot y x
ylimits
.
. Note that gamma has problem with datasets 1 and 4
.
ylimits 0 1
title Gamma AD
gamma anderson darling statistic plot y x subset x 2 3 5 6
.
ylimits 0 2
title Fatigue Life AD
fatigue life anderson darling statistic plot y x
.
end of multiplot
.
justification center
move 50 3
text Datasets
direction vertical
move 2 50
text Anderson-Darling Statistic
direction horizontal
|
Privacy
Policy/Security Notice
NIST is an agency of the U.S.
Commerce Department.
Date created: 02/09/2015 | ||||||||||||||||||||||||||||||||||