5.
Process Improvement
5.5.
Advanced topics
5.5.3.
How do you optimize a process?
5.5.3.1.
Single response case
5.5.3.1.2.
|
Single response: Confidence region for search path
|
|
|
|
|
|
"Randomness" means that the steepest ascent direction is just an
estimate and it is possible to construct a confidence "cone" around
this direction estimate
|
The direction given by the gradient
g' = (b0, b2, ... ,
bk) constitutes only a single (point) estimate
based on a sample of N runs. If a different set of N
runs were conducted, these would provide different parameter estimates,
which in turn would give a different gradient. To account for this
sampling variability, Box and
Draper gave a formula for constructing a "cone" around the
direction of steepest ascent that with certain probability contains the
true (unknown) system gradient given by
\( (\beta_{1}, \beta_{2}, \ldots , \beta_{k}) \).
The width of the confidence cone is useful to assess how reliable an
estimated search direction is.
Figure 5.4 shows such a cone for the steepest ascent direction in an
experiment with two factors. If the cone is so wide that almost every
possible direction is inside the cone, an experimenter should be very
careful in moving too far from the current operating conditions along
the path of steepest ascent or descent. Usually this will happen when
the linear fit is quite poor (i.e., when the R2 value is
low). Thus, plotting the confidence cone is not so important as
computing its width.
If you are interested in the details on how to compute such a cone (and
its width), see Technical Appendix 5B.
|
|
Graph of a confidence cone for the steepest ascent direction
|
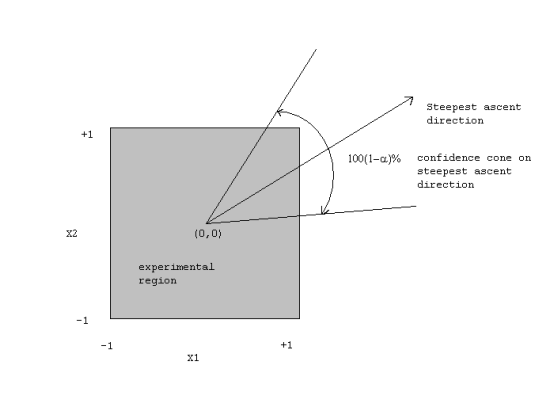
FIGURE 5.4: A Confidence Cone for the Steepest Ascent
Direction in an Experiment with 2 Factors
|
|
|
|
|
|
Technical Appendix 5B: Computing a Confidence Cone on the
Direction of Steepest Ascent
|
|
Details of how to construct a confidence cone for the direction
of steepest ascent
|
Suppose the response of interest is adequately described by a
first-order polynomial model. Consider the inequality
\( \sum_{i=1}^{k}{b_{i}^{2}} -
\frac{ \left( \sum_{i=1}^{k}{b_{i}x_{i}} \right) ^{2}}
{\sum_{i=1}^{k}{x_{i}^{2}}}
\le (k - 1)s_{b}^{2} F_{\alpha,k-1,n-p} \)
with
\( s_{b}^{2} = SS_{\mbox{error}} \frac{C_{jj}}{n - p} \)
Cjj is the j-th diagonal element of
the matrix (X'X)-1 (for
j = 1, ..., k these values are all equal if the
experimental design is a 2k-p factorial
of at least Resolution III), and X is the model matrix
of the experiment (including columns for the intercept and second-order
terms, if any). Any operating condition with coordinates
x' = (x1, x2, ...,
xk) that satisfies this inequality generates a
direction that lies within the
100(1 - \( \alpha \) )%
confidence cone of steepest ascent if
\( \sum_{i=1}^{k}{b_{i}x_{i}} > 0 \)
or inside the
100(1 - \( \alpha \))%
confidence cone of steepest descent if
\( \sum_{i=1}^{k}{b_{i}x_{i}} < 0 \)
|
|
Inequality defines a cone
|
The inequality defines a cone with the apex at the
origin and center line located along the gradient of
\( \hat{Y} \).
|
|
A measure of goodnes of fit:
\( \theta_{\alpha} \)
|
A measure of "goodness" of a search direction is given by the fraction
of directions excluded by the
100(1 - \( \alpha \))%
confidence cone around the steepest ascent/descent direction (see
Box and Draper, 1987)
which is given by:
\( \begin{array}{lcl}
\theta_{\alpha} & = & 1 - \phi_{\alpha} \\
& = & 1 - T_{k-1}
\left(
\frac{\sum_{i=1}^{k}{b_{i}^{2}}}
{s_{b}^{2}F_{\alpha,k-1,n-p}} - (k - 1)
\right) ^{1/2}
\end{array} \)
with Tk-1() denoting
the complement of the Student's t distribution function with
k-1 degrees of freedom (that is,
Tk-1(x) =
P(tk-1 ≥ x))
and
F\( \alpha \),
k-1, n-p
denotes an \( \alpha \)
percentage point of the F distribution with k-1
and n-p degrees of freedom, with n-p
denoting the error degrees of freedom. The value of
\( \theta_{\alpha} \)
represents the fraction of directions included by the confidence cone.
The smaller \( \theta_{\alpha} \)
is, the wider the cone is, with
0 ≤ \( \theta_{\alpha} \) ≤ 1.
Note that the inequality equation and the
"goodness measure" equation are valid when
operating conditions are given in coded units.
|
|
|
Example: Computing
\( \theta_{\alpha} \)
|
|
Compute \( s_{b}^{2} \)
from ANOVA table and Cjj
|
From the ANOVA table in the chemical experiment discussed
earlier
\( s_{b}^{2} = \frac{1}{4} (52.4579) = 13.1145 \)
since Cjj = 1/4 (j=2,3) for a
22 factorial. The fraction of directions excluded by
a 95 % confidence cone in the direction of steepest ascent is:
|
|
Compute \( \theta_{\alpha} \)
|
\( \begin{array}{lcl}
\theta_{0.05} & = & 1 - T_{1} \left[
\frac{(-1.2925)^{2} + (11.14)^{2}} {(13.1145)(5.99)} - 1 \right] ^{0.5} \\
& = & 1 - 0.29 \\
& = & 0.71
\end{array} \)
|
|
Conclusions for this example
|
since F0.05,1,6 = 5.99. Thus 71% of the
possible directions from the current operating point are excluded
with 95 % confidence. This is useful information that can be used to
select a step length. The smaller \( \theta_{\alpha} \)
is, the shorter the step should be, as the steepest ascent direction is
less reliable. In this example, with high confidence, the true steepest
ascent direction is within this cone of 29% of possible directions. For
k=2, 29% of 360o = 104.4o, so we are
95% confident that our estimated steepest ascent path is within plus
or minus 52.2o of the true steepest path. In this case, we
should not use a large step along the estimated steepest ascent path.
|

