
|
|
EXECUTEName:
The above command will write the data in the variable X to the file "dpst1f.dat" and then execute the command
The output in file "dpst2f.dat" will be read into the variable Y. Note that the first line written to dpst1f.dat will be an integer that specifies the number of lines in X. Although this command was motivated primarily to be used within a FUNCTION BLOCK or a STATISTIC BLOCK, it can be used independently of function blocks and statistic blocks. The LET FUNCTION command can be used to define functions in Dataplot. The FUNCTION BLOCK command can be used to define functions that cannot be defined using the LET FUNCTION command. For functions that cannot be defined using Dataplot commands within a function block, then the EXECUTE command provides an alternative that allows you to create your own functions in whatever language is most convenient.
where <file> is the name of the external file to be executed; <x> is a variable containing data that will be read from standard input of the external program; and <y> is a variable containing data that will be written to standard output by the external program.
LET Y = EXECUTE "MY FILES\OPT.EXE" X
The file name is currently limited to 80 characters.
It may be that you need to read additional information into the external program. You can have your external program read any additional needed files.
. Step 1:   Create the external program (for Linux)
.
capture script test.f
      program test
c
c     Test Dataplot LET ... EXECUTE .... command.
c
c     For this simple example, read in a data set and
c     compute the mean and standard deviation.
c
      real x(10000)
c
      xmean=0.0
      xsd=0.0
      nval=0
      read(*,*,end=9020,err=9020)nval
c
      sum1=0.0
      do 10 i=1,min(nval,10000)
         read(*,*,end=19,err=9020)x(i)
         sum1=sum1 + x(i)
   10 continue
   19 continue
      if(nval.ge.1)then
        xmean=sum1/real(nval)
      endif
c
      if(nval.gt.1)then
        sum1=0.0
        do 20 i=1,nval
           sum1=sum1 + (x(i)-xmean)**2
  20    continue
        xsd=sum1/real(nval-1)
      endif
c
 9020 continue
      write(*,*)xmean
      write(*,*)xsd
c
      stop
      end
end of capture
.
system gfortran -o test.exe  test.f
.
. Step 2:   Read the Data
.
skip 25
read zarr13.dat x
.
. Step 3:   Test the command
.
let y = execute ./test.exe  x
let ymean = y(1)
let ysd   = y(2)
Program 2:
. Step 1: Create and compile the Fortran code
.
capture script exec2.for
program exec
c
c Test Dataplot LET ... EXECUTE .... command.
c
c For this simple example, read in a data set and
c compute the 2-parameter Weibull log-likelihood
c equations (specifically, solve for the shape parameter).
c
real x(10000)
c
nval=0
read(*,*,end=9020,err=9020)nval
read(*,*,end=9020,err=9020)g
c
sum1=0.0
sum2=0.0
sum3=0.0
do 10 i=1,10000
read(*,*,end=19,err=9020)aval
z=log(aval)
y2=aval**g
w=y2*z
sum1=sum1 + w
sum2=sum2 + y2
sum3=sum3 + z
10 continue
19 continue
c
n=nval-1
c1=sum3/real(n)
c2=1.0/g
a=c2-(sum1/sum2) + c1
c
9020 continue
write(*,*)a
c
stop
end
end of capture
.
system gfortran -o exec2.exe exec2.for
.
. Step 1: Read the data
.
skip 25
read weibbury.dat x
skip 0
.
. Step 2: Define the function block
.
capture function block one f a g
let z = execute ./exec2.exe x
let a = z(1)
end of capture
.
list function block one
.
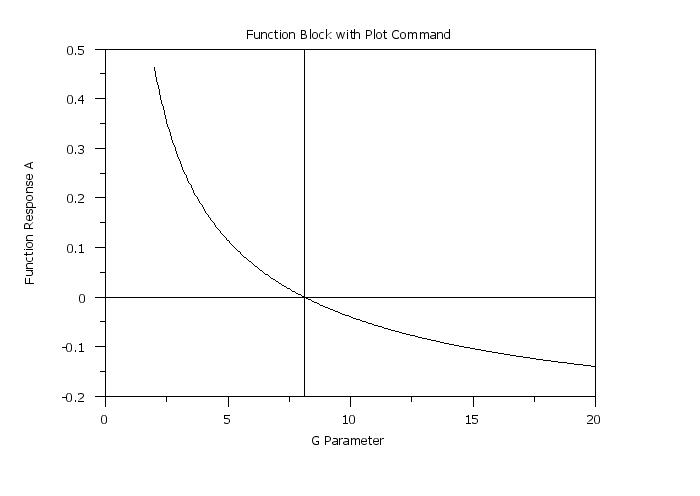
. Step 3: Plot the function
.
title offset 2
title case asis
label case ais
y1label Function Response A
x1label G Parameter
title Function Block with Plot Command
plot f for g = 2 0.05 20
.
. Step 3: Now use it to solve an equation
.
let yroot = roots f wrt g for g = 2 20
let ztemp = yroot(1)
.
line dash
drawsdsd 15 0 85 0
drawdsds ztemp 20 ztemp 90
The following output is generated
 ROOTS OF AN EQUATION
       ROOT VARIABLE                     = G
       SPECIFIED LOWER LIMIT OF INTERVAL =         2.0000000000
       SPECIFIED UPPER LIMIT OF INTERVAL =        20.0000000000

       NUMBER OF ROOTS FOUND IN INTERVAL =        1

 ROOT     1 =    8.117594


 THE NUMBER OF VALUES GENERATED FOR THE VARIABLE YROOT    =        1

 THE FIRST          COMPUTED VALUE OF YROOT    =   0.8117594E+01 (ROW     1)
 NOTE--THE ABOVE VALUE WAS THE ONLY VALUE COMPUTED FOR THIS VARIABLE.
| |||||||||||||||
|
Date created: 02/29/2016 Last updated: 12/11/2023 Please email comments on this WWW page to alan.heckert@nist.gov. |
|||||||||||||||