
|
|
LORENZ CURVEName:
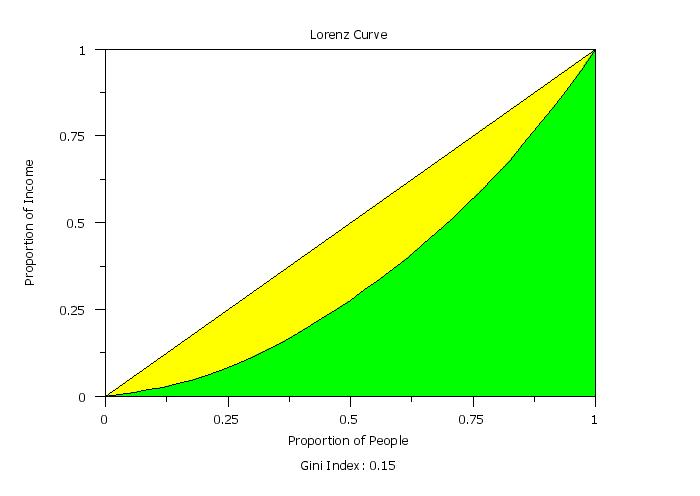
The Lorenz curve will have a 0 to 1 scale in both the horizontal and vertical directions. A reference line is drawn from (0,0) to (1,1). This curve represents perfect equality in the income distribution. The greater the distance from the reference line to the Lorenz curve the greater the inequality of the income distribution. The Gini index can be used to summarize the income inequality. The Gini index can be computed from the Lorenz curve as
The Gini index has been criticized for not distinguishing whether the inequality is in the center of the distribution or from the tails.
where <y> is the response variable; and where the <SUBSET/EXCEPT/FOR qualification> is optional. Note that <y> can be either a variable or a matrix. If <y> is a matrix, the Lorenz curve will be generated for all values in the matrix. The Gini index will be saved in the internal parameter GINI.
<SUBSET/EXCEPT/FOR qualification> where <y1> ... <yk> is a list of response variables; and where the <SUBSET/EXCEPT/FOR qualification> is optional. This syntax will overlay multiple Lorenz curves on the same plot. Note that the response variables (<y1> ... <yk>) can be either variables or matrices (or a mix of variables and matrices). For matrices, a Lorenz curve will be generated for all values in the matrix. The Gini indices will be saved in the internal parameters GINI1, GINI2, and so on.
<SUBSET/EXCEPT/FOR qualification> where <y> is the response variable; <x1> is a group-id variable; and where the <SUBSET/EXCEPT/FOR qualification> is optional. This syntax will generate a Lorenz curve for each distinct value in the group-id variable. The Lorenz curves will be generated on the same page. Matrix arguments are not accepted for the REPLICATED case. The Gini indices will be saved in the internal parameters GINI1, GINI2, and so on. There will be a Gini index for each distinct group.
<SUBSET/EXCEPT/FOR qualification> where <y> is the response variable; <x1> is the first group-id variable; <x2> is the second group-id variable; and where the <SUBSET/EXCEPT/FOR qualification> is optional. This syntax will cross tabulate the group-id variables and generate a Lorenz curves for each unique combination of values for the <x1> and <x2> group-id variables. The Lorenz curves will be generated on the same page. Matrix arguments are not accepted for the REPLICATED case. The Gini indices will be saved in the internal parameters GINI1, GINI2, and so on. There will be a Gini index for each distinct group.
LORENZ CURVE Y SUBSET TAG = 2 MULTIPLE LORENZ CURVE Y1 Y2 Y3 REPLICATED LORENZ CURVE Y X1 X2
. Step 1:   Read the data
.
skip 25
read electric.dat y x1 x2 x3
skip 0
.
. Step 2:   Generate the Lorenz curve
.
case asis
label case asis
title case asis
title offset 2
title Lorenz Curve
y1label Proportion of Income
x1label Proportion of People
.
region fill on on
region pattern solid solid
region fill color yellow green
.
lorenz curve y
.
let gini = round(gini,2)
justification center
move 50 5
text Gini Index: ^gini
 Program 2:
. Step 1: Read the data
.
skip 25
read weibbury.dat y1
read frechet.dat y2
read exp.dat y3
skip 0
.
. Step 2: Generate the Lorenz curve
.
case asis
label case asis
title case asis
title offset 2
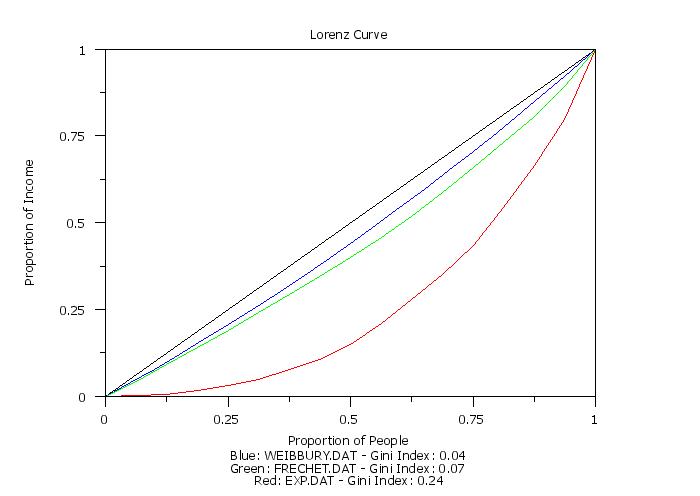
title Lorenz Curve
y1label Proportion of Income
x1label Proportion of People
.
line color black blue green red
.
multiple lorenz curve y1 y2 y3
.
let gini1 = round(gini1,2)
let gini2 = round(gini2,2)
let gini3 = round(gini3,2)
justification center
move 50 7
text Blue: WEIBBURY.DAT - Gini Index: ^gini1
move 50 4.5
text Green: FRECHET.DAT - Gini Index: ^gini2
move 50 2
text Red: EXP.DAT - Gini Index: ^gini3
Date created: 02/18/2015 |
Last updated: 12/04/2023 Please email comments on this WWW page to alan.heckert@nist.gov. | |||||||||||||