TIETJEN-MOORE TEST
Name:
Type:
Purpose:
Perform a Tietjen-Moore test for outliers.
Description:
The Tietjen-Moore test is a generalization of the Grubbs
test that can be used to test for multiple outliers in a
univariate data set. As with the Grubbs test, the Tietjen-Moore
test assumes that the underlying distribution follows an
approximately normal distribution.
It is important to note that the Tietjen-Moore test requires that
the suspected number of outliers be specified exactly. If this
is not known, it is recommended that the generalized extreme
studentized deviate test be used instead (this test only requires
an upper bound on the number of suspected outliers).
More formally, the Tietjen-Moore test can be defined as follows.
|
H0:
|
There are no outliers in the data set
|
|
Ha:
|
There are exactly k outliers in the data set
|
|
Test Statistic:
|
Sort the n data points from smallest to the largest
so that yi denotes the ith largest
data value.
The test statistic for the k largest points is
\(
L_{k} = \frac{\sum_{i=1}^{n-k}{(y_{i} - \bar{y}_{k})^{2}}}
{\sum_{i=1}^{n}{(y_{i} - \bar{y})^{2}}}
\)
with \( \bar{y} \)
denoting the sample mean for the full sample and
\( \bar{y}_{k} \) denoting the sample mean with the largest
k points removed.
The test statistic for the k smallest points is
\(
L_{k} = \frac{\sum_{i=k+1}^{n}{(y_{i} - \bar{y}_{k})^{2}}}
{\sum_{i=1}^{n}{(y_{i} - \bar{y})^{2}}}
\)
with \( \bar{y} \)
denoting the sample mean for the full sample and
\( \bar{y}_{k} \) denoting the sample mean with the smallest
k points removed.
To test for outliers in both tails, compute the absolute
residuals
\( r_{i} = |y_{i} - \bar{y}| \)
and then let zi denote the sorted absolute
residuals. The test statistic for this case is
\(
E_{k} = \frac{\sum_{i=k+1}^{n}{(z_{i} - \bar{z}_{k})^{2}}}
{\sum_{i=1}^{n}{(z_{i} - \bar{z})^{2}}}
\)
with \( \bar{z} \)
denoting the sample mean of the absolute residuals for the
full sample and \( \bar{z}_{k} \)
denoting the sample mean of the absolute residuals with the
largest k points removed.
|
|
Significance Level:
|
\( \alpha \)
|
|
Critical Region:
|
The critical region for the Tietjen-Moore test is determined
by simulation. The simulation is performed by generating
a standard normal random sample of size n and
computing the Tietjen-Moore test statistic. Typically,
10,000 random samples are used. The value of the
Tietjen-Moore statistic obtained from the data are compared
to this reference distribution.
Dataplot performs this simulation dynamically. The critical
values obtained may differ slightly from the critical values
given in the Tietjen-Moore paper.
|
It is recommended that formal outlier tests be complemented with
graphical methods. For example, a normal probability plot
can be used to determine if the normality assumption is reasonable
and also to determine an appropriate value for k.
Syntax 1:
Syntax 2:
Syntax 3:
Syntax 4:
TIETJEN-MOORE MULTIPLE TEST <y1> ... <yk>
<SUBSET/EXCEPT/FOR qualification>
where <y1> ... <yk> is a list of up to k
response variables;
and where the <SUBSET/EXCEPT/FOR qualification> is optional.
This syntax can also be used with the MINIMUM and MAXIMUM version
of the tests. This syntax performs a Tietjen-Moore test on ,
then on , and so on. Up to 30 response variables may be
specified.
Note that the syntax
TIETJEN-MOORE MULTIPLE TEST Y1 TO Y4
is supported. This is equivalent to
TIETJEN-MOORE MULTIPLE TEST Y1 Y2 Y3 Y4
Syntax 5:
TIETJEN-MOORE REPLICATED TEST <y> <x1> ... <xk>
<SUBSET/EXCEPT/FOR qualification>
where <y> is the response variable;
<x1> ... <xk> is a list of up to k group-id
variables;
and where the <SUBSET/EXCEPT/FOR qualification> is optional.
This syntax can also be used with the MINIMUM and MAXIMUM version
of the tests. This syntax peforms a cross-tabulation of
<x1> ... <xk> and performs a Tietjen-Moore test for each
unique combination of cross-tabulated values. For example, if
X1 has 3 levels and X2 has 2 levels, there will be a total of
6 Tietjen-Moore tests performed.
Up to six group-id variables can be specified.
Note that the syntax
TIETJEN-MOORE REPLICATED TEST Y X1 TO X4
is supported. This is equivalent to
TIETJEN-MOORE REPLICATED TEST Y X1 X2 X3 X4
Examples:
TIETJEN-MOORE TEST Y1
TIETJEN-MOORE TEST Y1 LABID
TIETJEN-MOORE MULTIPLE TEST Y1 Y2 Y3
TIETJEN-MOORE REPLICATED TEST Y X1 X2
TIETJEN-MOORE TEST Y1 SUBSET TAG > 2
TIETJEN-MOORE MINIMUM TEST Y1
TIETJEN-MOORE MAXIMUM TEST Y1
Note:
The number of outliers to test for is specified with the command
Note:
Masking and swamping are two issues that can affect outlier tests.
Masking can occur when we specify too few outliers in the test. For
example, if we are testing for a single outlier when there are in
fact two (or more) outliers, these additional outliers may influence
the value of the test statistic enough so that no points are
declared as outliers.
On the other hand, swamping can occur when we specify too many
outliers in the test. For example, if we are testing for two
outliers when there is in fact only a single outlier, both points
may be declared outliers.
The possibility of masking and swamping are an important reason
why it is useful to complement formal outlier tests with graphical
methods. Graphics can often help identify cases where masking or
swamping may be an issue.
Also, masking is one reason that trying to apply a single outlier
test sequentially can fail. If there are multiple outliers, masking
may cause the outlier test for the first outlier to return a
conclusion of no outliers (and so the testing for any additional
outliers is not done).
The Tietjen-Moore test is used to check for exactly k outliers.
If k is not specified correctly, the results of the
Tietjen-Moore test can be distorted.
If determining k is not obvious, then the generalized extreme
studentized deviate tests may be preferred since this test only
requires that an upper bound on the suspected number of outliers be
specified.
Note:
Tests for outliers are dependent on knowing the distribution of
the data. The Tietjen-Moore test assumes that the data come from an
approximately normal distribution. For this reason, it is
strongly recommended that the Tietjen-Moore test be complemented with
a normal probability plot. If the data are not approximately
normally distributed, then the Tietjen-Moore test may be detecting
the non-normality of the data rather than the presence of outliers.
Note:
You can specify the number of digits in the Tietjen-Moore output with
the command
SET WRITE DECIMALS <value>
Note:
The TIETJEN-MOORE TEST command automatically saves the following
parameters:
|
STATVAL
|
=
|
the value of the test statistic
|
|
PVAL
|
=
|
the p-value of the test statistic
|
|
CUTOFF0
|
=
|
the 0 percent point of the reference distribution
|
|
CUTOFF50
|
=
|
the 50 percent point of the reference distribution
|
|
CUTOFF75
|
=
|
the 75 percent point of the reference distribution
|
|
CUTOFF90
|
=
|
the 90 percent point of the reference distribution
|
|
CUTOFF95
|
=
|
the 95 percent point of the reference distribution
|
|
CUTOFF975
|
=
|
the 97.5 percent point of the reference distribution
|
|
CUTOFF99
|
=
|
the 99 percent point of the reference distribution
|
If the MULTIPLE or REPLICATED option is used, these values will
be written to the file "dpst1f.dat" instead.
Note:
In addition to the TIETJEN-MOORE TEST command, the following commands
can also be used:
LET A = TIETJEN-MOORE Y
LET A = TIETJEN-MOORE MINIMUM Y
LET A = TIETJEN-MOORE MAXIMUM Y
In addition to the above LET command, built-in statistics are
supported for 20+ different commands (enter
HELP STATISTICS
for details).
Default:
Synonyms:
MULTIPLE TIETJEN MOORE is a synonym for TIETJEN MOORE MULTIPLE
REPLICATION TIETJEN MOORE is a synonym for TIETJEN MOORE REPLICATION
Related Commands:
Reference:
Gary Tietjen and Roger Moore (August 1972), "Some Grubbs-Type
Statistics for the Detection of Several Outliers",
Technometrics, Vol. 14, No. 3, pp. 583-597.
Applications:
Implementation Date:
Program:
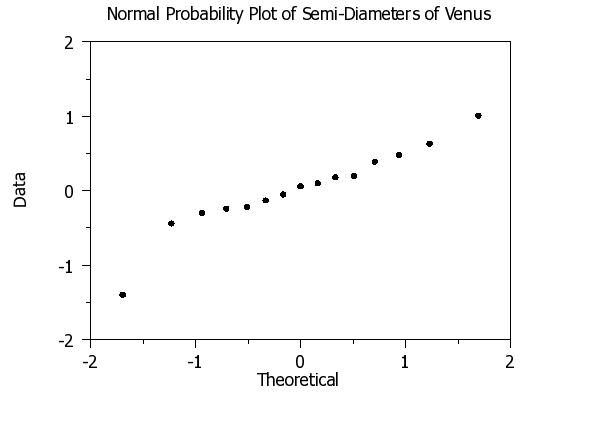
.  Following example from Tietjen-Moore paper
READ Y
-1.40
-0.44
-0.30
-0.24
-0.22
-0.13
-0.05
 0.06
 0.10
 0.18
 0.20
 0.39
 0.48
 0.63
 1.01
END OF DATA
.
.  First generate a normal probability plot
.
LABEL CASE ASIS
TITLE CASE ASIS
TITLE OFFSET 5
.
Y1LABEL Data
X1LABEL Theoretical
TITLE Normal Probability Plot of Semi-Diameters of Venus
LINE BLANK
CHAR CIRCLE
CHAR FILL ON
LET H = 1.2
LET W = H*0.75
CHAR HW H W
.
NORMAL PROBABILITY PLOT Y
.
.  Now perform the Tietjen-Moore test
.
SET WRITE DECIMALS 5
LET NOUTLIER = 2
TIETJEN-MOORE Y
The following output is generated
            Tietjen-Moore Test for Multiple Outliers: Two-Sided Case
                            (Assumption: Normality)

Response Variable: Y

H0: There are no outliers
Ha: The     2 most extreme points are outliers
Potential Outlier Value Tested:                      -1.39999
Potential Outlier Value Tested:                       0.06000

Summary Statistics:
Number of Observations:                                    15
Sample Minimum:                                      -1.39999
Sample Maximum:                                       1.01000
Sample Mean:                                          0.01800
Sample SD:                                            0.55094

Tietjen-Moore Test Statistic Value:                   0.29199
CDF Value:                                            0.96560
P-Value                                               0.03440


Percent Points of the Reference Distribution
-----------------------------------
  Percent Point               Value
-----------------------------------
            0.0    =          0.064
            1.0    =          0.237
            2.5    =          0.277
            5.0    =          0.315
           10.0    =          0.362
           25.0    =          0.435
           50.0    =          0.508
          100.0    =          0.755

Conclusions (Lower 1-Tailed Test)
----------------------------------------------
  Alpha    CDF   Critical Value     Conclusion
----------------------------------------------
    10%    10%            0.362      Reject H0
     5%     5%            0.315      Reject H0
   2.5%   2.5%            0.277      Accept H0
     1%     1%            0.237      Accept H0

  *Critical Values Based on    10000 Monte Carlo Simulations
Date created: 09/09/2010
Last updated: 12/11/2023
Please email comments on this WWW page to
alan.heckert@nist.gov.
|
