|
|
INDEX OF DISPERSIONName:
where s2 is the sample variance and The index of dispersion is related to the coefficient of variation (the ratio of the standard deviation to the mean) and the coefficient of dispersion (the ratio of the mean absolute deviation to the median). The index of dispersion is also referred to the coefficient of dispersion. However, Dataplot reserves this term for the ratio of the median absolute deviation to the mean. The index of dispersion should typically only be used for data measured on a ratio scale. That is, the data should be have a meaningful zero. The index of dispersion is sometimes used for count data. If the count data follows a Poisson distribution, then the mean and variance should be equal and the index of dispersion is 1. If the counts follow a geometric or negative binomial, then the index of dispersion should be greater than 1. If the counts follow a binomial distribution, the index of dispersion should be less than 1.
<SUBSET/EXCEPT/FOR qualification> where <y> is a response variable; <par> is a parameter where the index of dispersion value is saved; and where the <SUBSET/EXCEPT/FOR qualification> is optional.
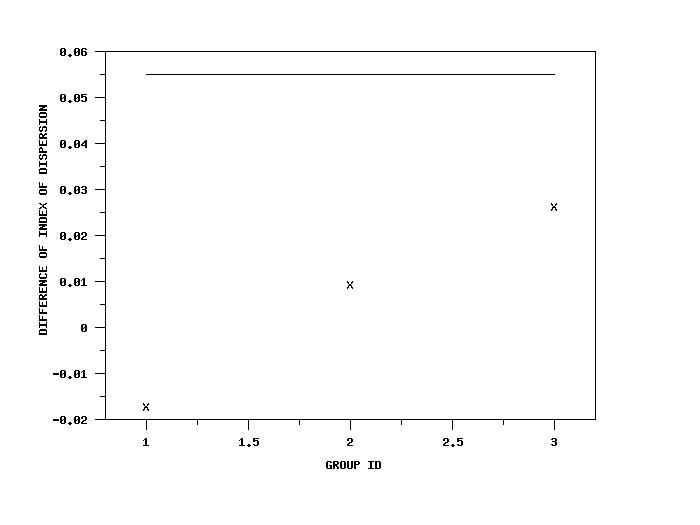
<SUBSET/EXCEPT/FOR qualification> where <y1> is the first response variable; <y2> is the second response variable; <par> is a parameter where the difference of the index of dispersion values is saved; and where the <SUBSET/EXCEPT/FOR qualification> is optional.
LET D = INDEX OF DISPERSION Y1 SUBSET TAG > 2
LET D = DIFFERENCE OF INDEX OF DISPERSION Y1 Y2
2017/06: Added DIFFERENCE OF INDEX OF DISPERSION
LET LAMBDA = 2.9
LET Y1 = POISSON RANDOM NUMBERS FOR I = 1 1 100
LET D = INDEX OF DISPERSION Y1
Program 2:
. Step 1: Create the data
.
skip 25
read gear.dat y x
skip 0
set write decimals 6
.
. Step 2: Define plot control
.
title case asis
title offset 2
label case asis
.
y1label Index of Dispersion
x1label Group
title Index of Dispersion for GEAR.DAT
let ngroup = unique x
xlimits 1 ngroup
major x1tic mark number ngroup
minor x1tic mark number 0
tic mark offset units data
x1tic mark offset 0.5 0.5
y1tic mark label decimals 3
.
character X
line blank
.
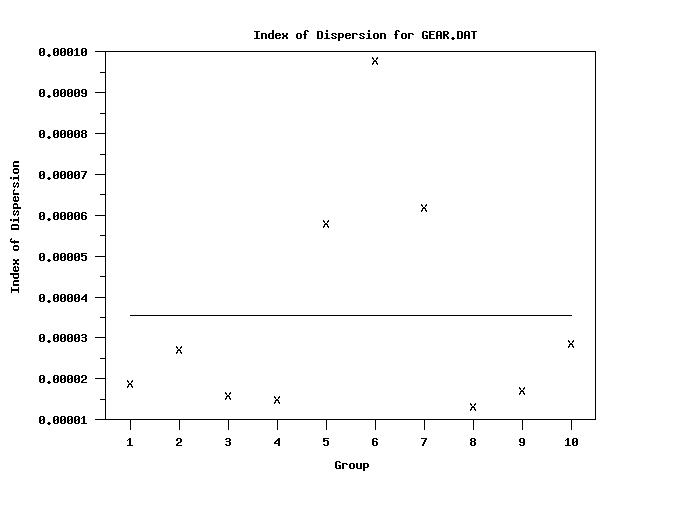
set statistic plot reference line average
index of dispersion plot y x
.
tabulate index of dispersion y x
            Cross Tabulate INDEX OF DISPERSION

(Response Variables: Y        )
---------------------------------------------
       X          |   INDEX OF DISPER
---------------------------------------------
       1.000000   |          0.000019
       2.000000   |          0.000027
       3.000000   |          0.000016
       4.000000   |          0.000015
       5.000000   |          0.000058
       6.000000   |          0.000098
       7.000000   |          0.000062
       8.000000   |          0.000013
       9.000000   |          0.000017
      10.000000   |          0.000029
Program 3:
SKIP 25 READ IRIS.DAT Y1 TO Y4 X . LET A = DIFFERENCE OF INDEX OF DISPERSION Y1 Y2 SET WRITE DECIMALS 4 TABULATE DIFFERENCE OF INDEX OF DISPERSION Y1 Y2 X 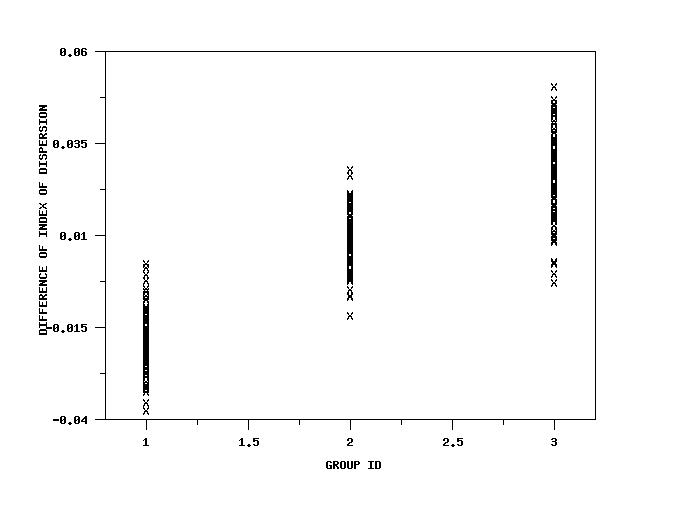
| |||||||||||||||||||||
|
Privacy
Policy/Security Notice
NIST is an agency of the U.S. Commerce Department.
Date created: 01/24/2017 |
|||||||||||||||||||||