RESCALED SUM
Name:
Type:
Purpose:
Compute the rescaled sum of a variable.
Description:
The rescaled sum has the formula:
\( \mbox{RSZ} = \frac{\sum_{i=1}^{N}{X_{i}}}{\sqrt{N}} \)
with N denoting the number of observations. This statistic has
application in the ISO 13528 proficiency testing standard.
Syntax 1:
LET <par> = RESCALED SUM <y>
<SUBSET/EXCEPT/FOR qualification>
where <y> is the response variable;
<par> is a parameter where the computed rescaled sum
is saved;
and where the <SUBSET/EXCEPT/FOR qualification> is optional.
Syntax 2:
LET <par> = DIFFERENCE OF RESCALED SUM <y1> <y2>
<SUBSET/EXCEPT/FOR qualification>
where <y1> is the first response variable;
<y2> is the second response variable;
<par> is a parameter where the computed difference of
the rescaled sums is saved;
and where the <SUBSET/EXCEPT/FOR qualification> is optional.
This syntax computes the recaled sum of <y1> and <y2> and
then computes the difference of the two sums.
Examples:
LET A = RESCALED SUM Y1
LET A = RESCALED SUM Y1 SUBSET TAG > 2
LET A = DIFFERENCE OF RESCALED SUM Y1 Y2
Note:
The rescaled sum is sometimes used in the context of ISO 13528
proficiency studies for the case where there are multiple rounds
of the proficiency study. Specifcally, the following two plots
are sometimes generated
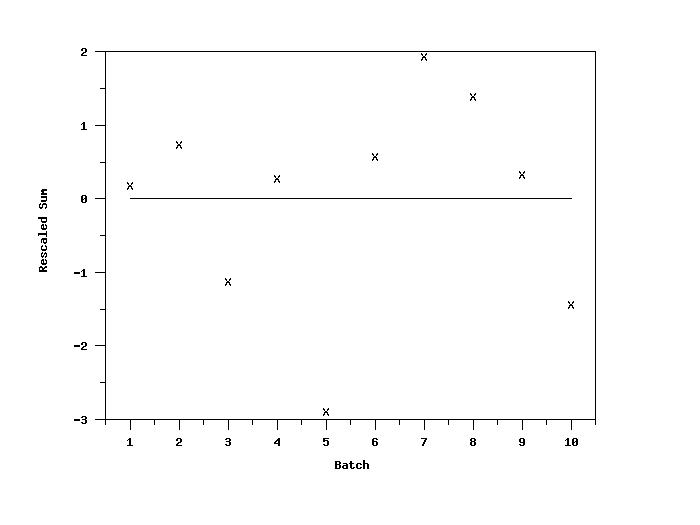
- A plot of the rescaled sum versus the laboratory where the
summation is over all rounds and all materials for a given
laboratory. Laboratories with an absolute value greater than
2 are of possible concern (i.e., warning) and those with an
absolute value greater than 3 are of concern (i.e., action
signal). The advantage of this statistic is that it has the
same interpretation as the z-scores. The disadvantage is
that large magnitude z-scores of opposite sign can
cancel each other.
- A plot of the relative laboratory performance (RLP) versus the
rescaled sum for all laboratories. A box is formed for
the rescaled sum between -2 and 2 and for RLP between 0 and 1.5.
Laboratories outside this box are identified as needing
attention.
Note:
In some applications it may be desired to cap the value
of outliers. This is most common when the response variable
is a z-score or some other standardized score.
To specify this value, enter the command
where <value> is typically 3 or 4 (if the reponse data are
z-scores or z-score type data). Note that the value
represents an absolute value. For example, if CAPVALUE is 4, values
greater than 4 will be set to 4 and values less than -4 will be set
to -4.
Note:
Dataplot statistics can be used in a number of commands. For
details, enter
Default:
Synonyms:
Related Commands:
Applications:
ISO 13528 Proficiency Testing
Implementation Date:
2012/2
2012/6: Added DIFFERENCE OF RESCALED SUM
Program 1:
SKIP 25
READ Y1 =
LET Y1 = NORMAL RANDOM NUMBERS FOR I = 1 1 100
LET SSQ = RESCALED SUM Y1
The result is -0.4749098.
Program 2:
SKIP 25
READ GEAR.DAT Y X
LET Y = ZSCORE Y
.
CHARACTER X BLANK
LINE BLANK SOLID
TIC MARK OFFSET UNITS DATA
X1TIC MARK OFFSET 0.5 0.5
.
LABEL CASE ASIS
Y1LABEL Rescaled Sum
X1LABEL Batch
RESCALED SUM PLOT Y X
|
Privacy
Policy/Security Notice
Disclaimer |
FOIA
NIST is an agency of the U.S.
Commerce Department.
Date created: 09/07/2012
Last updated: 11/09/2015
Please email comments on this WWW page to
alan.heckert@nist.gov.
|
