
|
|
TRUE POSITIVEName:
The parameters N11, N12, N21, and N22 denote the counts for each category. Success and failure can denote any binary response. Dataplot expects "success" to be coded as "1" and "failure" to be coded as "0". Some typical examples would be:
In these examples, the "ground truth" is typically given as variable 1 while some estimator of the ground truth is given as variable 2. The proportion of true positives is then N11/N (i.e., the number of cases where variable 1 and variable 2 are both "successes"). In the context of the first examples above, the test detected the disease when it was in fact present.
<SUBSET/EXCEPT/FOR qualification> where <y1> is the first response variable; <y2> is the second response variable; <par> is a parameter where the computed true positive proportion is stored; and where the <SUBSET/EXCEPT/FOR qualification> is optional.
LET A = TRUE POSITIVE Y1 Y2 SUBSET TAG > 2
LET TRUEPOS = TRUE POSITIVE Y1 Y2 LET TPCOUNT = N*TRUEPOS LET TPPERC = 100*TRUEPOS
In this case, if variable one denotes "ground truth" and variable two denotes the estimate of ground truth, then we define:
So the number of true positives is simply the number of times where the value for variable two is equal to the corresponding value for variable one. As another way of thinking of this, if you generate a cross-tabulation of the two variables, the number of true positives is the sum of the elements on the diagonal in this table. The TRUE POSITIVE and TRUE NEGATIVE commands are treated as synonyms for the RxC case. The RxC case is currently only supported for raw data.
CROSS TABULATE TRUE POSITIVE Y1 Y2 X1 X2
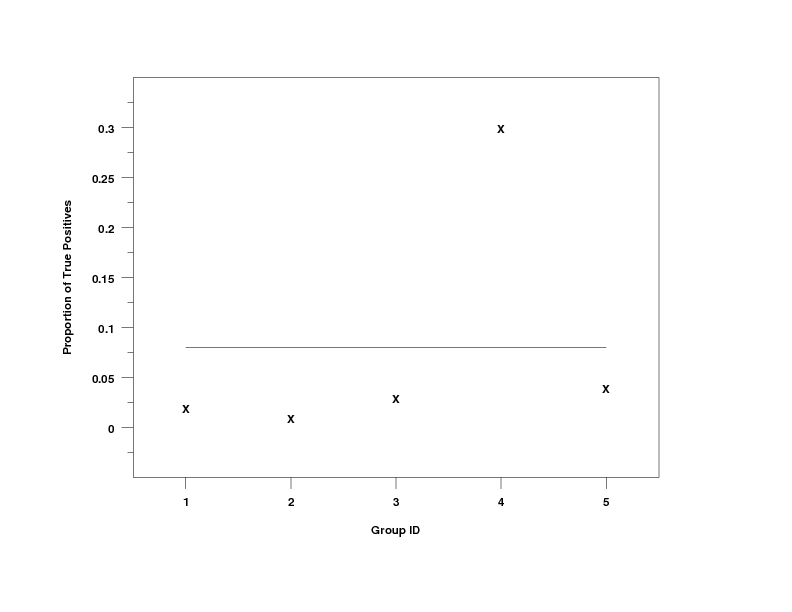
TRUE POSITIVES PLOT Y1 Y2 X
BOOTSTRAP TRUE POSITIVES PLOT Y1 Y2
let n = 1
.
let p = 0.2
let y1 = binomial rand numb for i = 1 1 100
let p = 0.1
let y2 = binomial rand numb for i = 1 1 100
.
let p = 0.4
let y1 = binomial rand numb for i = 101 1 200
let p = 0.08
let y2 = binomial rand numb for i = 101 1 200
.
let p = 0.15
let y1 = binomial rand numb for i = 201 1 300
let p = 0.18
let y2 = binomial rand numb for i = 201 1 300
.
let p = 0.6
let y1 = binomial rand numb for i = 301 1 400
let p = 0.45
let y2 = binomial rand numb for i = 301 1 400
.
let p = 0.3
let y1 = binomial rand numb for i = 401 1 500
let p = 0.1
let y2 = binomial rand numb for i = 401 1 500
.
let x = sequence 1 100 1 5
.
let a = true positives y1 y2 subset x = 1
tabulate true positives y1 y2 x
.
label case asis
xlimits 1 5
major xtic mark number 5
minor xtic mark number 0
xtic mark offset 0.5 0.5
ytic mark offset 0.05 0.05
y1label Proportion of True Positives
x1label Group ID
character x blank
line blank solid
.
true positives plot y1 y2 x
Date created: 4/13/2007 |
|||||||||||||||||||||||||||||||||||||||||||||||||||||||||||||