
6.4. Introduction to Time Series Analysis
6.4.4. Univariate Time Series Models
6.4.4.3. |
Seasonality |
Seasonality is quite common in economic time series. It is less common in engineering and scientific data.
If seasonality is present, it must be incorporated into the time series model. In this section, we discuss techniques for detecting seasonality. We defer modeling of seasonality until later sections.
- A run sequence plot will often show seasonality.
- A seasonal subseries plot is a specialized technique for showing seasonality.
- Multiple box plots can be used as an alternative to the seasonal subseries plot to detect seasonality.
- The autocorrelation plot can help identify seasonality.
The run sequence plot is a recommended first step for analyzing any time series. Although seasonality can sometimes be indicated with this plot, seasonality is shown more clearly by the seasonal subseries plot or the box plot. The seasonal subseries plot does an excellent job of showing both the seasonal differences (between group patterns) and also the within-group patterns. The box plot shows the seasonal difference (between group patterns) quite well, but it does not show within group patterns. However, for large data sets, the box plot is usually easier to read than the seasonal subseries plot.
Both the seasonal subseries plot and the box plot assume that the seasonal periods are known. In most cases, the analyst will in fact know this. For example, for monthly data, the period is 12 since there are 12 months in a year. However, if the period is not known, the autocorrelation plot can help. If there is significant seasonality, the autocorrelation plot should show spikes at lags equal to the period. For example, for monthly data, if there is a seasonality effect, we would expect to see significant peaks at lag 12, 24, 36, and so on (although the intensity may decrease the further out we go).
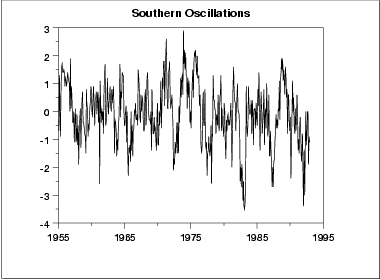
No obvious periodic patterns are apparent in the run sequence plot.
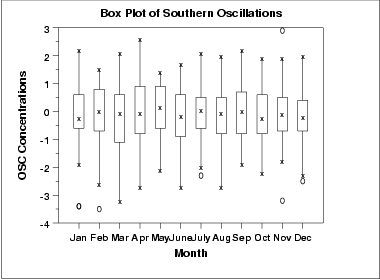
The means for each month are relatively close and show no obvious pattern.
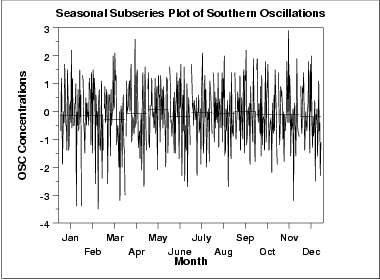
As with the seasonal subseries plot, no obvious seasonal pattern is apparent.
Due to the rather large number of observations, the box plot shows the difference between months better than the seasonal subseries plot.
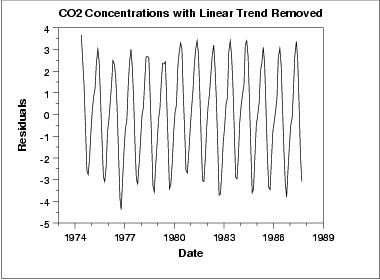
This plot shows periodic behavior. However, it is difficult to determine the nature of the seasonality from this plot.
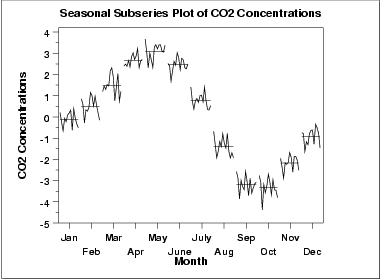
The seasonal subseries plot shows the seasonal pattern more clearly. In this case, the CO2 concentrations are at a minimun in September and October. From there, steadily the concentrations increase until June and then begin declining until September.
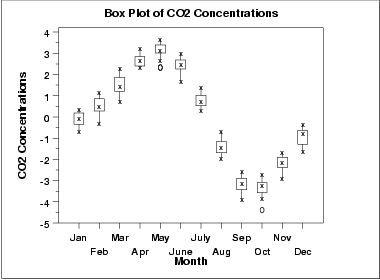
As with the seasonal subseries plot, the seasonal pattern is quite evident in the box plot.
